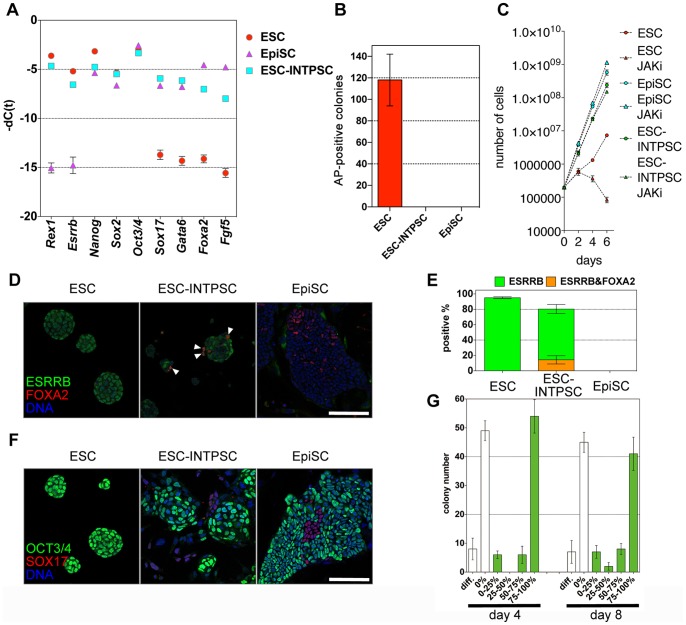
Figure 2. Features of ESC-INTPSCs intermediate between ESCs and EpiSCs.
(A) Comparison of gene expression in ESCs, EpiSCs, and ESC-INTPSCs. (B) The number of AP-positive colonies formed in the LIF/2i condition four days after 1000 cells were seeded per dish. (C) Proliferation of ESCs, EpiSCs, and ESC-INTPSCs with or without JAKi. (D) Expression of ESRRB and FOXA2. White arrows indicate ESRRB- and FOXA2-double–positive cells. Scale bar, 100 µm. (E) Percentage of ESRRB-positive or ESRRB- and FOXA2-double–positive cells in ESCs, ESC-INTPSCs, and EpiSCs. (F) Expression of OCT3/4 and SOX17. Scale bar, 100 µm. (G) The number of Oct3/4-GFP–positive or –negative colonies derived from single cells at day 4 and 8.

