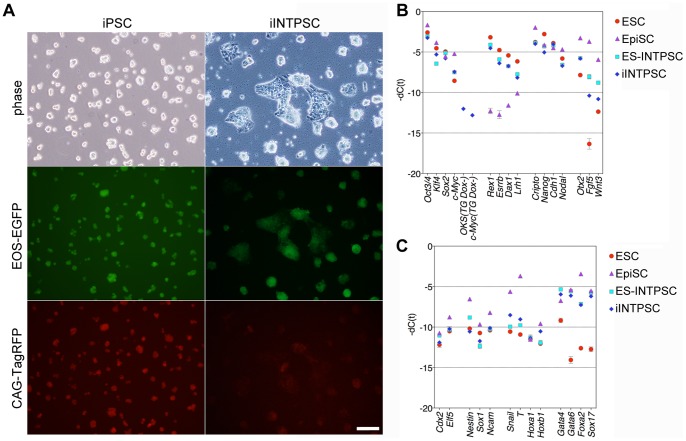
Figure 4. Establishment of iINTPSCs and gene expression in these cells.
(A) Morphologies of iPSCs and iINTPSCs. Scale bar, 100 µm. (B) Comparison of endogenous expression levels of the four reprogramming genes, transgenes, ESC-specific genes, and EpiSC-specific genes among ESCs, EpiSCs, ESC-INTPSCs, and iINTPSCs. (C) Comparison of trophectodermal, epidermal, mesodermal, and endodermal marker genes among ESCs, EpiSCs, ESC-INTPSCs, and iINTPSCs.

