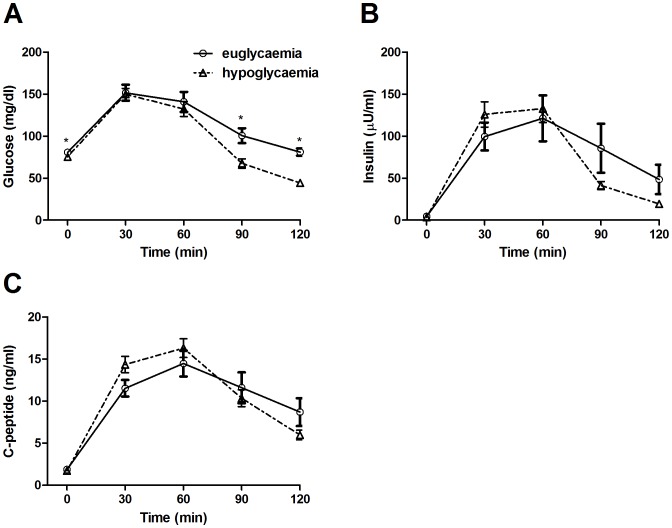
Figure 2. Post-operative OGTT glucose, insulin and C-peptide concentration in patients with euglycemia and hypoglycemia.
(A) Glucose, (B) insulin and (C) C-peptide concentrations during the course of the post-operative 2 h OGTT in patients with euglycemia (n = 17, full lines) and patients with post-load hypoglycemia (n = 18, dashed lines). Differences between pre and post-operative values were calculated with paired t-test. Differences between patients with euglycemia and hypoglycemia were calculated by unpaired student's t-test.*p<0.05.

