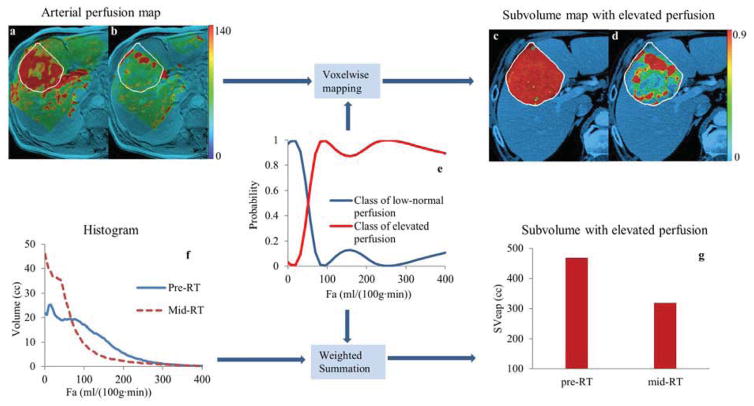
Figure 1.
Generation of tumor subvolume with elevated arterial perfusion. Color-coded hepatic arterial perfusion images (unit: ml/(100g·min)) of a patient at pre-RT (a) and mid-RT (b) were transformed to probability maps of the subvolumes with elevated arterial perfusion (c and d), respectively, by applying the probabilistic membership function (e). The white curves contoured the gross tumor volumes. The volume of the tumor subvolume with elevated arterial perfusion was sum of the arterial perfusion histogram (f) weighted by the probability function (e). Note that there was 32% reduction in the tumor subvolume from pre-RT to mid-RT (g), suggesting early tumor response.

