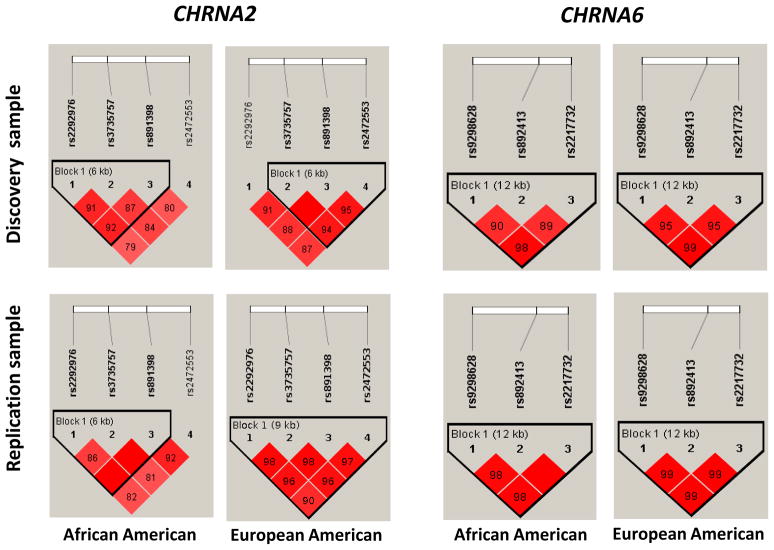
Figure 1.
LD structures for CHRNA2 (left) and CHRNA6 (right) SNPs in AAs and EAs from discovery and replication samples. Haploview (Barrett et al. 2005) was used to calculate all D values, and haplotype blocks were defined according to Gabriel et al. (2002). The number in each box represents the D value for each SNP pair surrounding that box.

