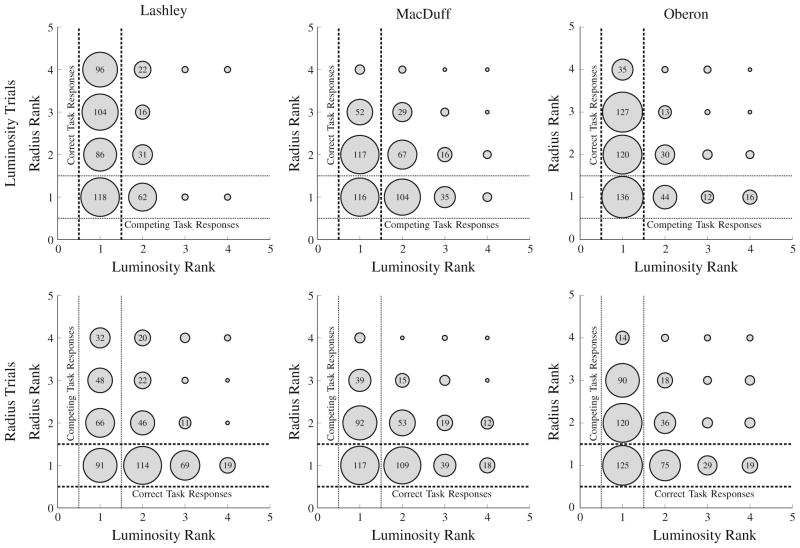
Fig. 6.
Frequency plot for the first response in a 4-item list, as a function of the stimulus rank in each of the psychophysical dimensions during Experimental Phase 2. As in Fig. 3, responses falling between the dashed lines are correct, and those falling between the dotted lines are those that are ranked first according to the distractor dimension. In Experimental Phase 2, subjects showed greater interference than in Phase 1

