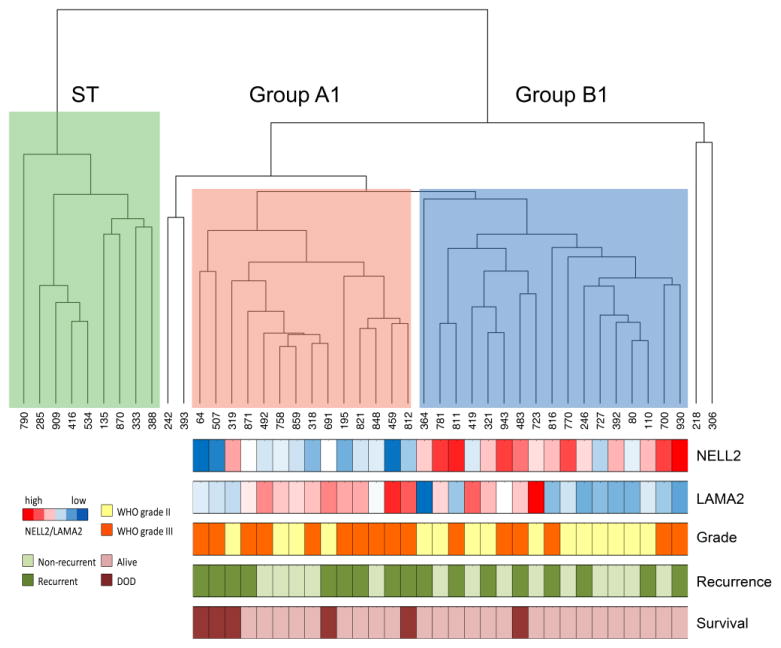
Fig. 1. Transcriptome profiling reveals two posterior fossa EPN sub-groups.
Unbiased hierarchical clustering of 44 primary EPN samples based on the top 5% of variant genes (n=883) reveals a distinct supratentorial (ST) located tumor sub-group (green) and 2 posterior fossa (PF) subgroups designated Group A1 (red) and B1 (blue). Four samples fell outside of the 3 main clusters and were excluded from further analyses. Below Groups A1 and B1 are a heatmap of NELL2 and LAMA2 expression and color-coded bars to indicate histologic grade (WHO grade II = yellow; WHO grade III = orange), recurrence (recurrent = dark green, non-recurrent = light green), and survival (died of disease = maroon, alive = pink).

