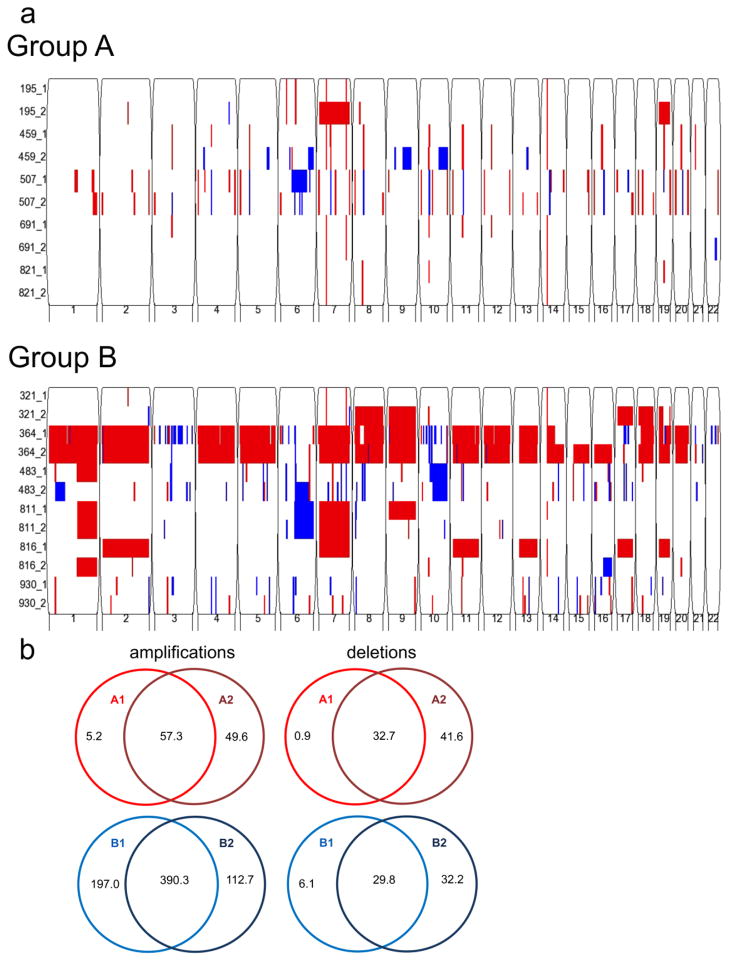
Fig. 2. Identification of sub-group-specific copy number alterations (CNA) in primary and recurrent posterior fossa EPN genomes.
(a) Genomic analysis using Illumina HumanOmni 2.5-Quad BeadChip SNP microarray reveals fewer CNAs in Group A (top panel) than Group B (bottom panel). Both groups generally conserve their CNAs at recurrence. Sample number is listed on the y-axis (primary = _1, recurrence = _2), and chromosome number is listed on the x-axis. Amplification = red, deletion = blue. (b) Venn diagrams depict average copy number amplifications and deletions in kilobases. Recurrent Group A (GA2) (n=5) and Group B (GB2) (n=6) convey a similar number of CNAs to their primary counterparts, GA1 and GB1 respectively.

