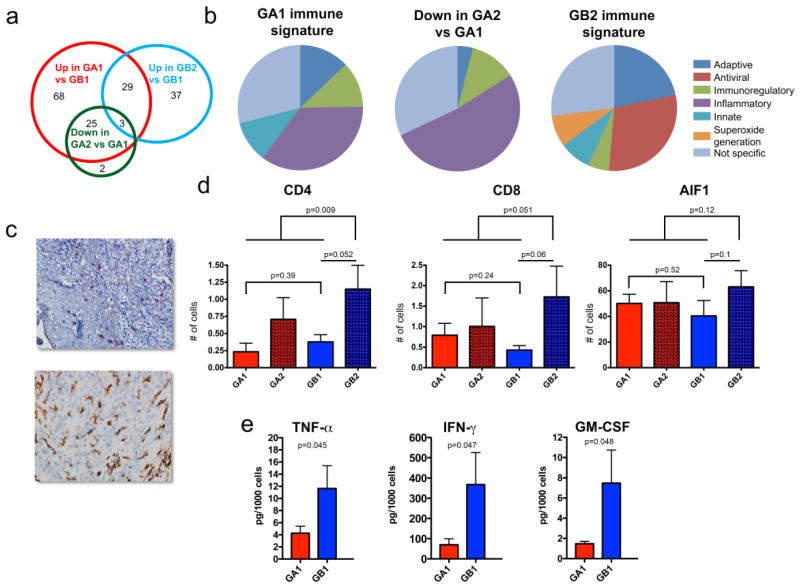
Fig. 5. Posterior fossa EPN reveal distinct sub-group-specific immunophenotypes at diagnosis and recurrence.
(a) Venn diagram of overlapping “immune response” genes that are (i) overexpressed in Group A1 versus B1 (up in A1 vs B1), (ii) overexpressed in Group B2 versus B1 (up in B2 vs B1), and (iii) decreased in Group A2 versus A1 (down in A2 vs A1). (b) Pie charts representing specific immune-functional categories for genes comprising (i) Group A1 immune signature (n=93), (ii) Group B2 immune signature (n=37), and (iii) decreased in Group A2 versus A1 immune genes that overlapped with the Group A1 immune signature (n=25). (c) Representative histology of (upper panel) tumor-infiltrating cytotoxic T-cells (CD8; red) and helper T-cells (CD4; brown), and (lower panel) tumor-infiltrating microglia/macrophages (AIF1; brown) in PF EPN (original magnification 400×). (d) Average tumor-infiltrating CD4 and CD8 positive cells per 20 high power fields (HPFs) and average tumor infiltrating AIF-1 positive cells per 10 HPFs in 6 Group A and 7 Group B matching primary and recurrent pairs. (e) Significantly higher levels of TNFα, IFNγ and GM-CSF are secreted from Group B1 than Group A1 tumor-infiltrating CD4 helper T-cells.

