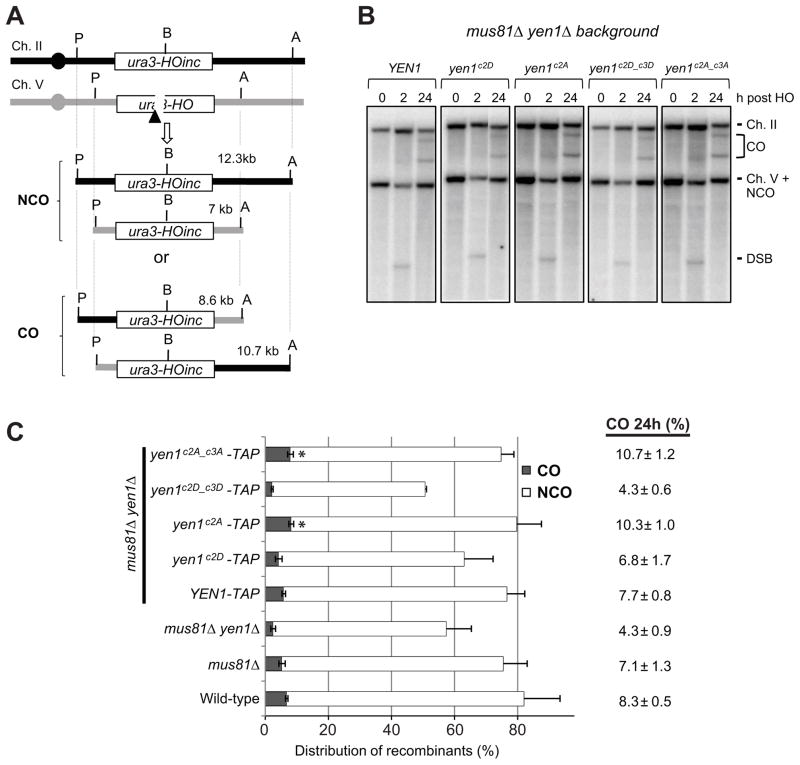
Figure 7. Mis-regulation of Cdk sites on Yen1 influences CO formation.
A) Schematic of the ectopic recombination assay used to monitor CO formation between ura3 repeats (Mazon et al., 2012). P and A mark the PvuII and ApaLI restriction sites used to monitor CO formation by Southern blot and B indicates the HO cut site. B) CO products are detected as ApaLI (A)/PvuII (P) restriction fragments of 10.7 and 8.6 kb in Southern blot analysis of DNA extracted from cells after HO-endonuclease induction. The chromosome V band represents entirely NCO products by 24 h. Only the larger of the two DSB fragments is present under the gel conditions used. C) Quantitation of CO and NCO products from gels in B normalized to the plating efficiency of the indicated strains. Values for the raw estimate of % COs at 24 h are shown and are averages of at least 3 independent trials. Error bars and values are standard deviations. Asterisks indicate p-values < 0.05 from a Students t-test comparing CO to that from the YEN1-TAP strain.

