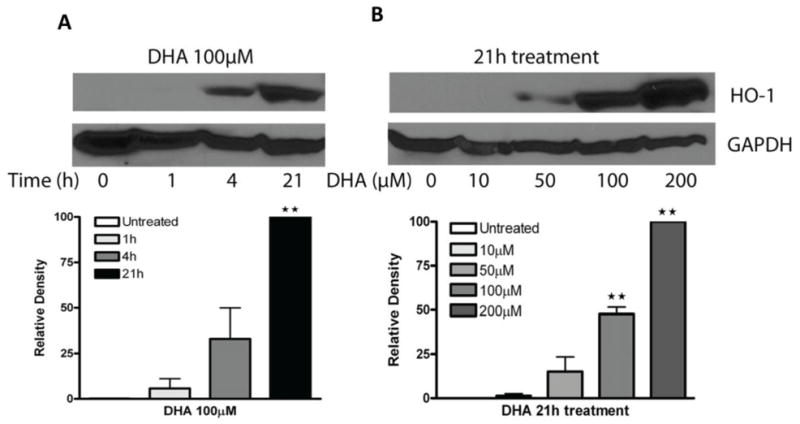
Figure 1. Effects of DHA on HO-1 expression in cancer cells.

A2780 cells were treated with DHA at the indicated durations (A) or concentrations (B). Cell lysates were prepared and Western blot was performed using antibodies against HO-1 and GAPDH. Shown are representative images of three experiments. The relative density of the HO-1 band was quantified, normalized to that of GAPDH, and expressed as percentages relative to the highest expression level in DHA-treated cells. **, P < 0.01, compared to untreated cells using one-way ANOVA followed by Dunnett’s analysis.
