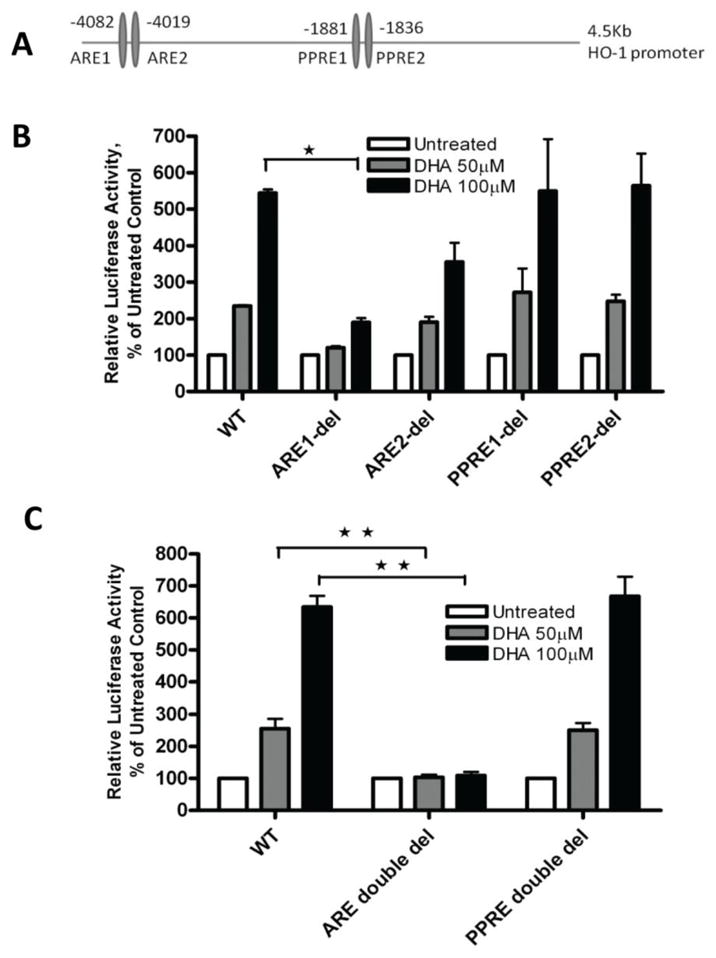
Figure 5. Identification of the DNA binding elements that mediate the DHA-induced increase in HO-1 promoter activity.

A. A diagram showing the relative locations of the AREs and PPREs present in the human HO-1 gene promoter. B. A2780 cells were transfected with the wild-type (WT) PGL3/4.5-HO-1 promoter reporter construct or a single deletion mutant and treated with DHA at the indicated concentrations for 21 hours at 48 hours post-transfection. Cell lysates were prepared and luciferase activity was assayed. C. A2780 cells were transfected with the wild-type PGL3/4.5-HO-1 promoter reporter construct or a double deletion mutant and treated with DHA at the indicated concentrations for 21 hours. Cell lysates from B and C were prepared and luciferase activity was assayed. Data are expressed as percentages of the value detected in untreated control cells (bar, SEM, n=3). *, P<0.05, **, P<0.01, compared with untreated control cells, using one-way ANOVA followed by Dunnett’s analysis.
