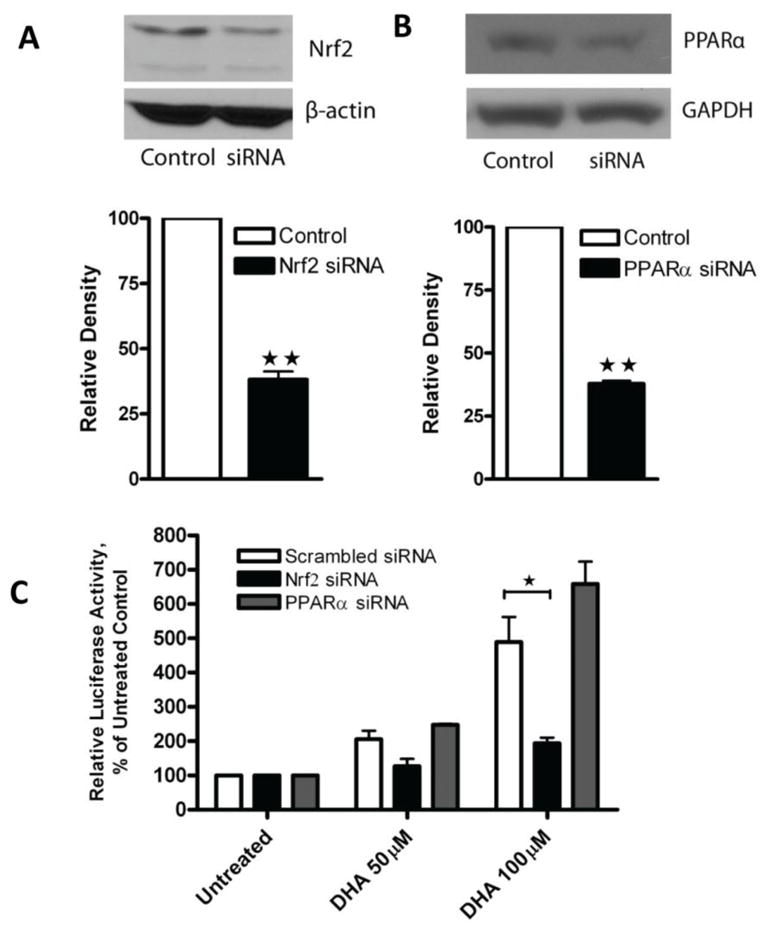
Figure 6. The role of Nrf2 in DHA-induced increase in HO-1 promoter activity.

A. A2780 cells were transfected with 225 nM of scrambled siRNA or Nrf2 siRNA. After 48 hours whole cell lysates were prepared and Western blot was performed using antibodies against Nrf2 and β-actin. B. A2780 cells were transfected with 225 nM of scrambled siRNA, or PPARα siRNA. After 48 hours cell lysates were prepared and Western blot was performed using antibodies against PPARα and GAPDH. The relative density of the Nrf2 or PPARα band was quantified, normalized to that of β-actin or GAPDH, and expressed as percentages relative to the expression level in control cells. **, P < 0.01, compared to untreated cells using one-way ANOVA followed by Dunnett’s analysis. C. A2780 cells were co-transfected with the PGL3/4.5-HO-1 promoter reporter construct and scrambled siRNA, Nrf2 siRNA, or PPARα siRNA. Forty-eight hours after transfection, cells were treated with DHA at the indicated concentrations for 21 hours. Cell lysates were prepared and luciferase activity was assayed. Data are expressed as percentages of the value detected in untreated control cells (bar, SEM, n=3). *, P<0.05, compared to untreated control cells, using one-way ANOVA followed by Dunnett’s analysis.
