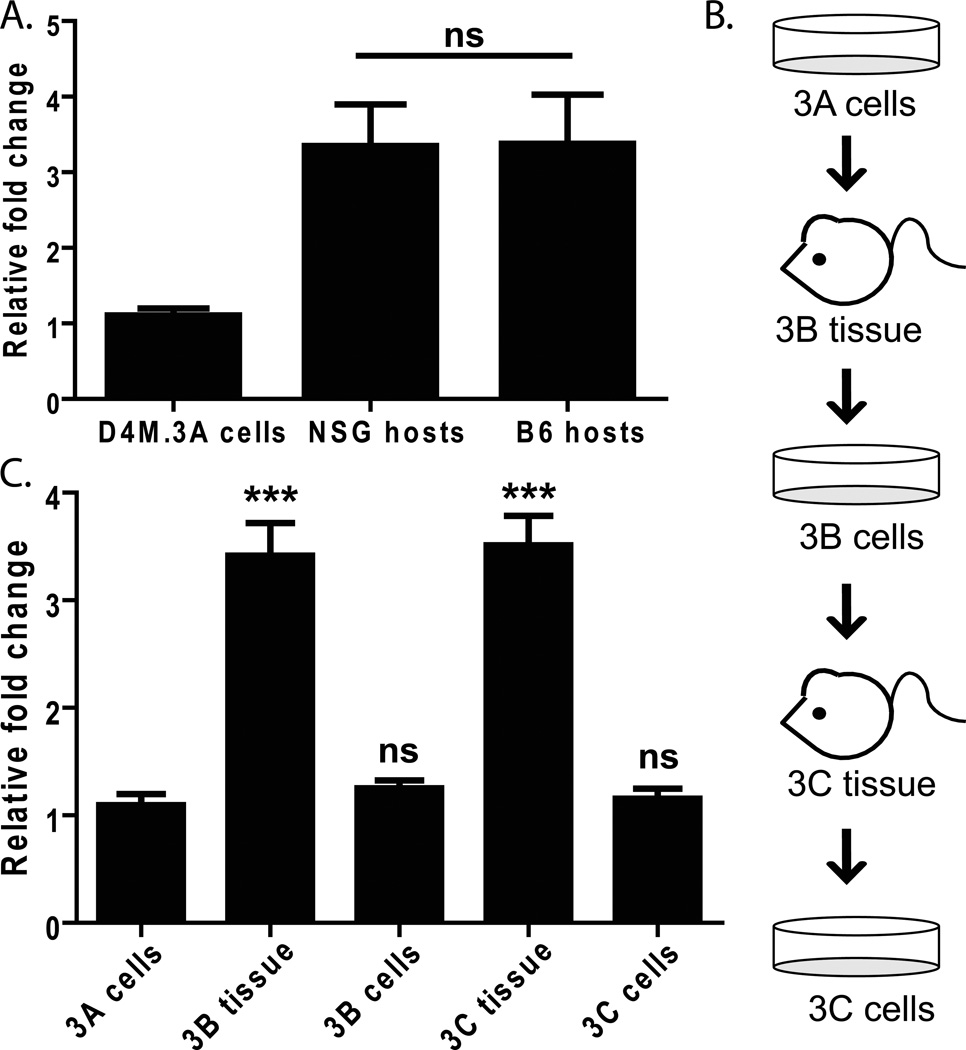
Figure 4. Expression of the melanoma specific antigen, pmel.
(A) RT-PCR comparing pmel expression in RNA made from D4M.3A cells and tumor tissue from NSG and B6 host mice injected with 3,000 D4M.3A cells. Samples were normalized to Gapdh and fold change was calculated relative to D4M.3A cells. T-test was performed comparing the averages of 4 NSG mice and 4 B6 mice. (B) Schematic of the protocol used to passage D4M.3A cells into mice (3B tissue), then back into culture (3B cells), and back into mice and culture (3C). (C) RNA was extracted from cells and tissue represented in 4B and pmel expression levels were measured with RT-PCR. All samples were normalized to Gapdh and fold change and significance were calculated relative to D4M.3A cells. T-test results are represented as: ns = not significant, * = P < 0.05, ** = P < 0.005, *** = P < 0.0005).

