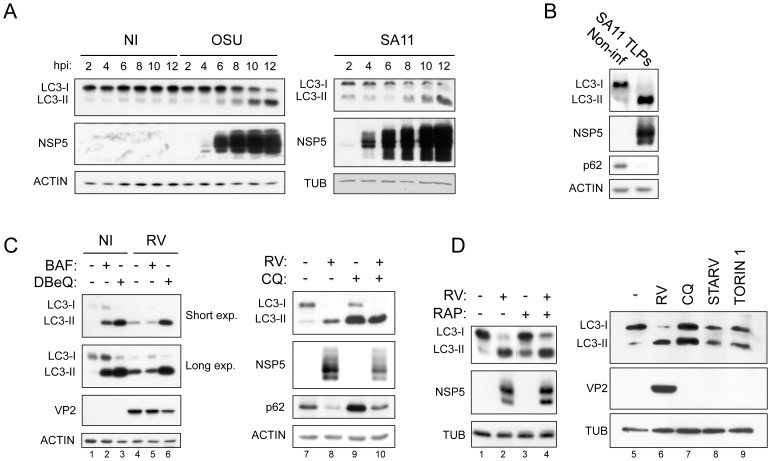
Figure 1. LC3 lipidation induced by RV infection.
A) Western blot of extracts from non-infected (NI) and OSU- or SA11-infected MA104 cells at different times post-infection. Crude viral preparations were used for infection. B) As in A, using SA11 purified triple-layered particles (TLPs) (13 hpi). C–D) Western blots of extracts from NI and OSU-infected cells at 13 hpi, treated or not with BAF (0.1 µM), DBeQ (15 µM), CQ (50 µM), RAP (0.1 µM) or torin 1 (0.25 µM), or maintained under starvation conditions, as indicated.

