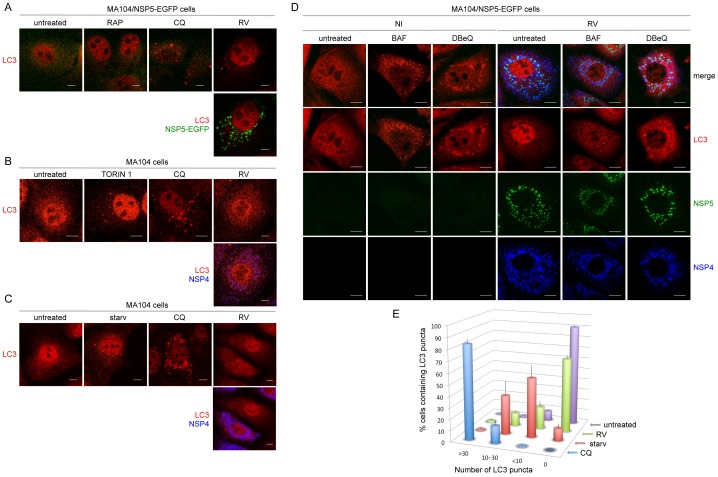
Figure 2. Autophagosomes in RV-infected cells.
A–D) Confocal immunofluorescence of non-infected (NI) and RV-infected (OSU strain, 13 hpi; MOI: 0,5 in A–C; 5 in D) MA104/NSP5-EGFP cells (A, D) and MA104 cells (B, C). Cells were treated or not with BAF (0.1 µM), DBeQ (15 µM), CQ (50 µM), RAP (0.1 µM), or torin 1 (0.25 µM), or maintained under starvation conditions (starv), as indicated. Autophagosomes were visualized with an anti-LC3 antibody (red). In A and D viroplasms were visualized using NSP5-EGFP (green). In B and C NSP4 was visualized using an anti-NSP4 antibody (blue). Single optical sections are shown. Scale bar is 5 µm. Images are representative of three independent experiments in which at least 150 cells per each experimental condition were analyzed. E) Quantification of LC3 puncta: the results are expressed as mean ±SEM from at least three independent samples for each experimental condition.

