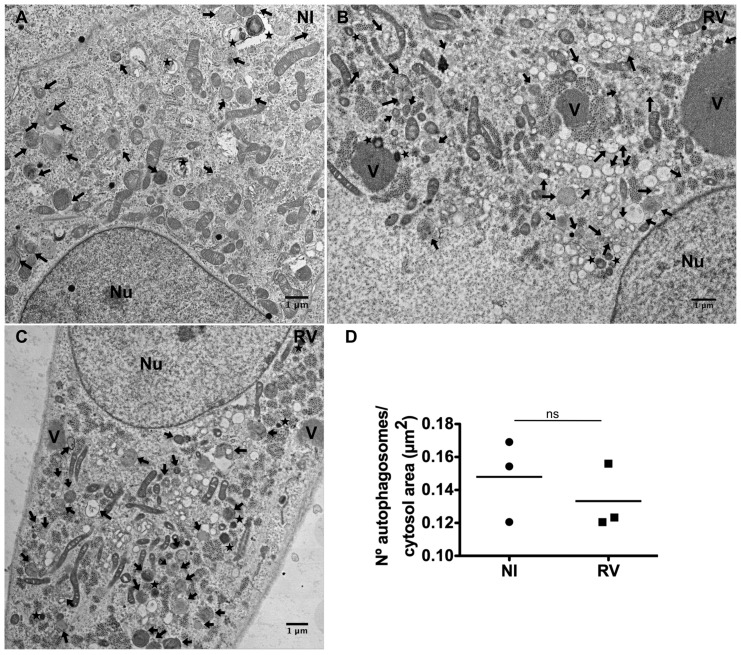
Figure 4. Electron microscopy of autophagosomes in RV-infected cells.
High-definition electron microscopy of non-infected (A) and RV-infected (SA11 strain; MOI, 250 VFU/ml) (B and C) MA104 cells at 14 hpi. V, viroplasms; Nu, nucleus; black arrows, AVi (early/initial autophagic vacuoles corresponding to autophagosomes); stars, AVd (late/degradative autophagic vacuoles including amphisomes and autolysosomes). Scale bars are 1 µm. D) Quantification of autophagosomes in non-infected (NI) and RV-infected MA104 cells (14 hpi). The data correspond to the mean of three-independent experiments with 25 cells per experimental point. Student's t-test, ns, p>0.05.

