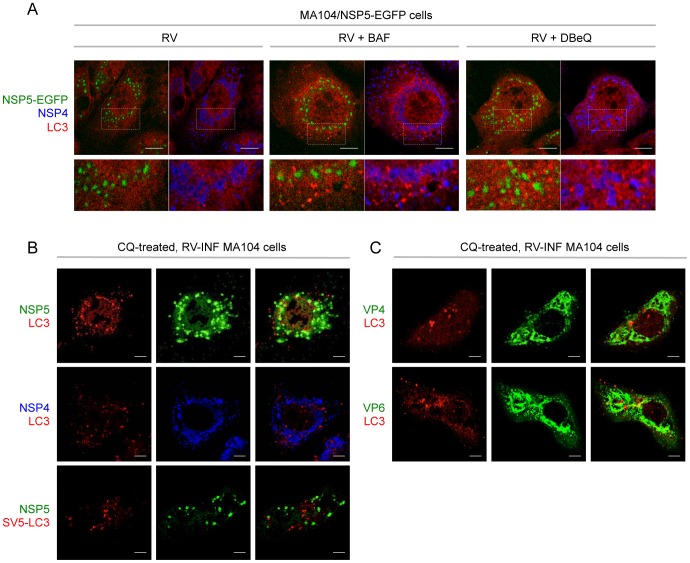
Figure 5. Cellular localization of LC3 in RV-infected cells.
Confocal immunofluorescence of RV-infected (OSU strain, 13 hpi; MOI, 5) MA104/NSP5-EGFP cells (A) and MA104 cells (B–C). In B, bottom row, cells were transiently transfected with the pSV5-LC3 construct. Where indicated, autophagy inhibitors (BAF, DBeQ, CQ) were used. Autophagosomes were visualized with an anti-LC3 antibody (red) in A, in the upper and middle rows of B and in C, and with an anti-SV5 antibody (red) in the bottom row of B. Viroplasms were visualized using the fluorescence of NSP5-EGFP in A and with an anti-NSP5 antibody (green) in B. NSP4, VP4 and VP6 were visualized using anti-NSP4 (blue), anti-VP6 (green) and anti-VP4 (green) antibodies, respectively. In A, bottom row shows magnification of insets indicated by dotted squares. Single optical sections are shown. Scale bar, 5 µm. Images are representative of three independent experiments in which at least 150 cells per each experimental condition were analyzed.

