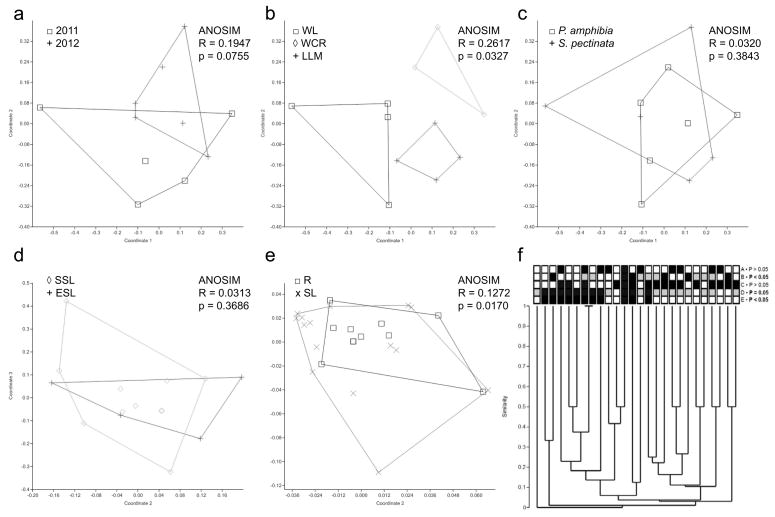
Fig. 3.
Community analyses of fungal endophyte communities. Panels indicate results of non-metric multidimensional scaling using Jaccard’s index, and relevant ANOSIM results (panels a–e), and results of cluster analyses (panel f). Only taxa and reservoirs sampled in both collection periods are included, and all singleton OTU were excluded. Endophyte communities did not differ significantly as a function of collection period (a), but did differ significantly among reservoirs (b) (WL, Watson Lake; WCR, Willow Creek Reservoir; LLM, Lower Lake Mary). Communities did not differ significantly between host species (c), nor between emergent (ESL) and submerged (SSL) photosynthetic tissues (d). However, communities differed significantly overall between roots (R) and shoots (SL) (panel e). Panel (f) summarizes these results in a hierarchical manner through cluster analysis with terminals coded as follows: row A, sampling year (black, 2011; white, 2012); row B, reservoir (black, WCR; grey, WL; white, LLM); row C, host species (black, Persicaria; white, Stuckenia); row D, tissue type (black, roots; grey, submerged photosynthetic tissue; white, emergent photosynthetic tissue); row E, roots (black) vs. photosynthetic tissue (white). P-values for each row indicate results of z-test evaluating relative similarity of terminals in the same category (e.g., same year, same reservoir, same host species, same tissue type) vs. different categories. Significant values (P<0.05) reveal strong effects of tissue type and reservoir on endophyte community structure, complementing NMDS and ANOSIM results (panels b and e).

