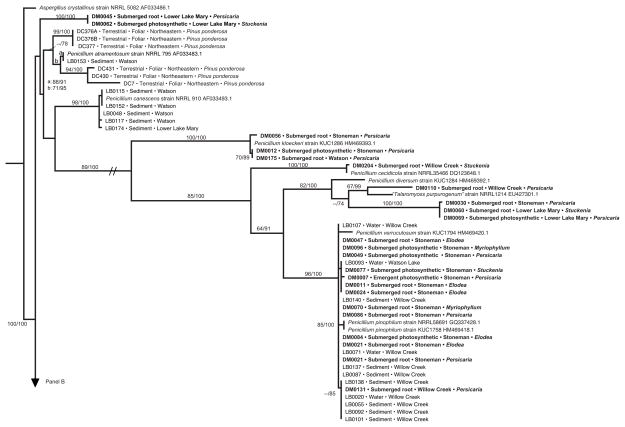
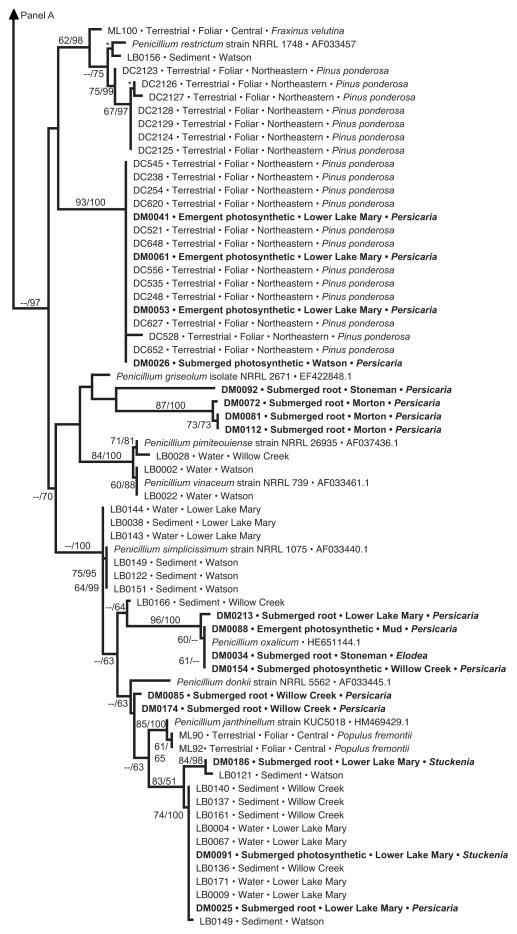
Fig. 4.
Phylogenetic analysis of Penicillium endophytes of aquatic plants, spread over two panels (a, b). Topology reflects the most likely tree based on analyses of ITS rDNA, with support values indicating maximum likelihood bootstrap (before slash; ≥60% shown) and Bayesian posterior probabilities (after slash; ≥60% shown). Strains in bold were obtained from aquatic plants in this study; terminals indicate isolate number (cf. Table S2), tissue type, lake or reservoir, and genus of the host species. These are placed into the larger context of (1) closely related species of Penicillium obtained from GenBank; (2) endophytes from terrestrial plants in north-central (‘central’) or northeastern Arizona, with terminal labels indicating isolate number, status as foliar endophytes of terrestrial plants, and host species [45 and Arnold et al., unpublished data]; and (3) samples of Pencillium spp. collected directly from water or sediment of the same reservoirs, with terminal labels indicating isolate number, substrate, and site [63]. One terminal is labeled ‘Talaromyces purpurogenus’; quotation marks are used because the species is considered equivalent to Pencillium purpurogenum, but is labeled as Talaromyces in GenBank. Hatch marks (panel a) indicate long branch shortened 25% for illustration purposes. Asterisks indicate high support in cases in which too little space was available to depict support values


