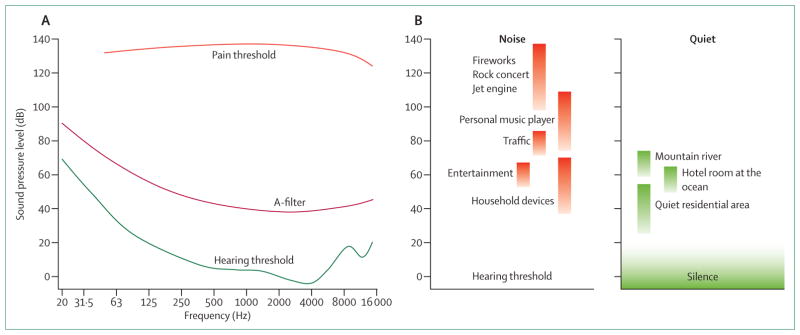
Figure 1. Sound pressure levels.

(A) The sensitivity of the auditory system depends on sound frequency and sensitivity is highest between 2000 Hz and 5000 Hz (green line). The A-filter (dark red line) is a frequency-weighting of sound pressure levels that mimics the sensitivity of the auditory system (eg, low-frequency sounds contribute little to the A-weighted dB level). (B) A-weighted sound pressure levels for several environmental sounds, emphasising that whether or not a sound is perceived as noise depends largely on the context and the individual, and is only partly determined by its sound pressure levels. For example, spectators attending a rock concert might not perceive the music as noise, whereas residents in the vicinity of the venue might call it noise, even though sound pressure levels are much lower there than for inside.
