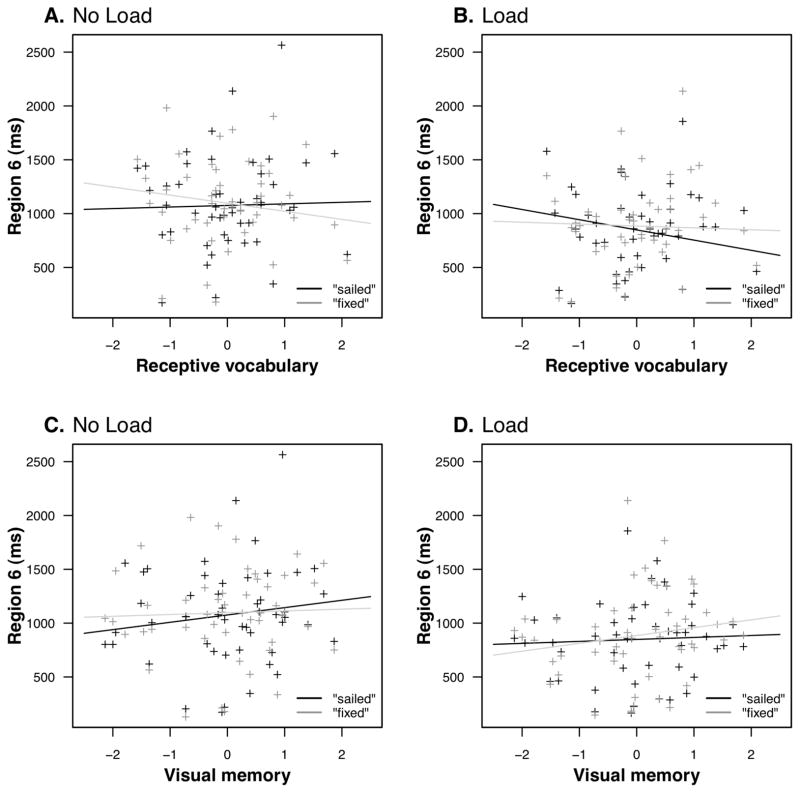
Figure 9.
Scatter plots showing RTs from the composite analysis of Region 6. Plots show the interaction of IQ-partialled Receptive Vocabulary (A and B) and Serial Order Memory (C and D) with Memory Load and Interference. When Interference is present (right panel) readers with higher vocabulary scores are more affected.

