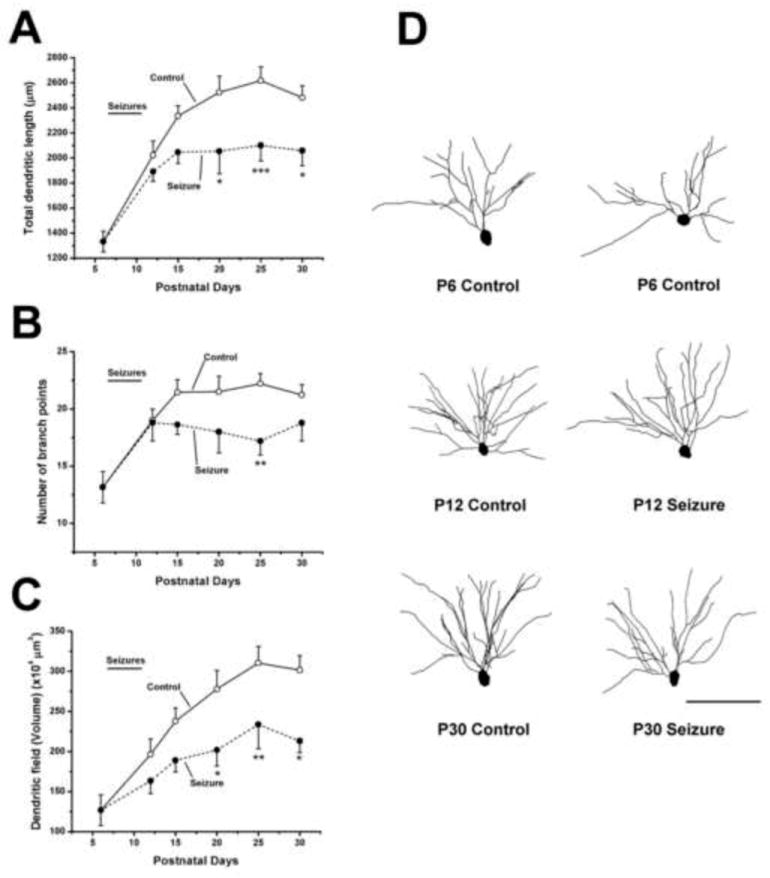
Figure 1.

Growth of hippocampal dendrites is suppressed following the induction of seizures on postnatal days 7 through 11. Graphs summarize results from experiments in which the dendrites from control and flurothyl -treated CA1 hippocampal pyramidal cells were reconstructed and analyzed for differences in (A) total length, (B) numbers of branch points and (C) the volume of the dendritic field. Following 15 seizures between P7 to P11 (demarcated by a line labeled seizures above each graph) a dramatic decrease in the rate of dendrite growth were observed based on measures of the three parameters analyzed. (D) Representative Neurolucida reconstructions of dendrites of GFP positive CA1 pyramidal neurons at selected ages. The soma and basilar dendrites of these cells are shown and clearly illustrate that pyramidal cells from P30 control mice have more elaborate dendritic arbors than those from mice that experienced seizures in infancy. Differences in arbor complexity were not apparent at P12. Two control neurons from P6 mice are shown to illustrate baseline arbor branching and length. Results are presented as mean ± S.E.M. Control: n was between 12 and 29 neurons per age group, Seizure: n was 9–25 per age group.* p ≤ 0.05, ** p ≤ 0.01, *** p≤ 0.001 when comparing seizure groups to controls at the same age. Scale bar = 100 μm
