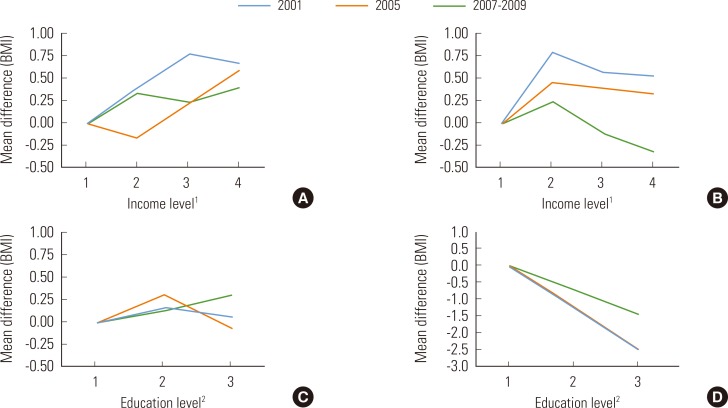
Figure 2.
Fully adjusted mean differences in body mass index (BMI) for 2001, 2005, and 2007 to 2009 Korea National Health and Nutrition Examination Survey stratified by sex and socioeconomic status (income and education level). (A) Men, (B) women, (C) men, and (D) women. 1Quartile levels of income. 2Three levels of education (1, up to 9 years; 2, 10 to 12 years; 3, ≥13 years).

