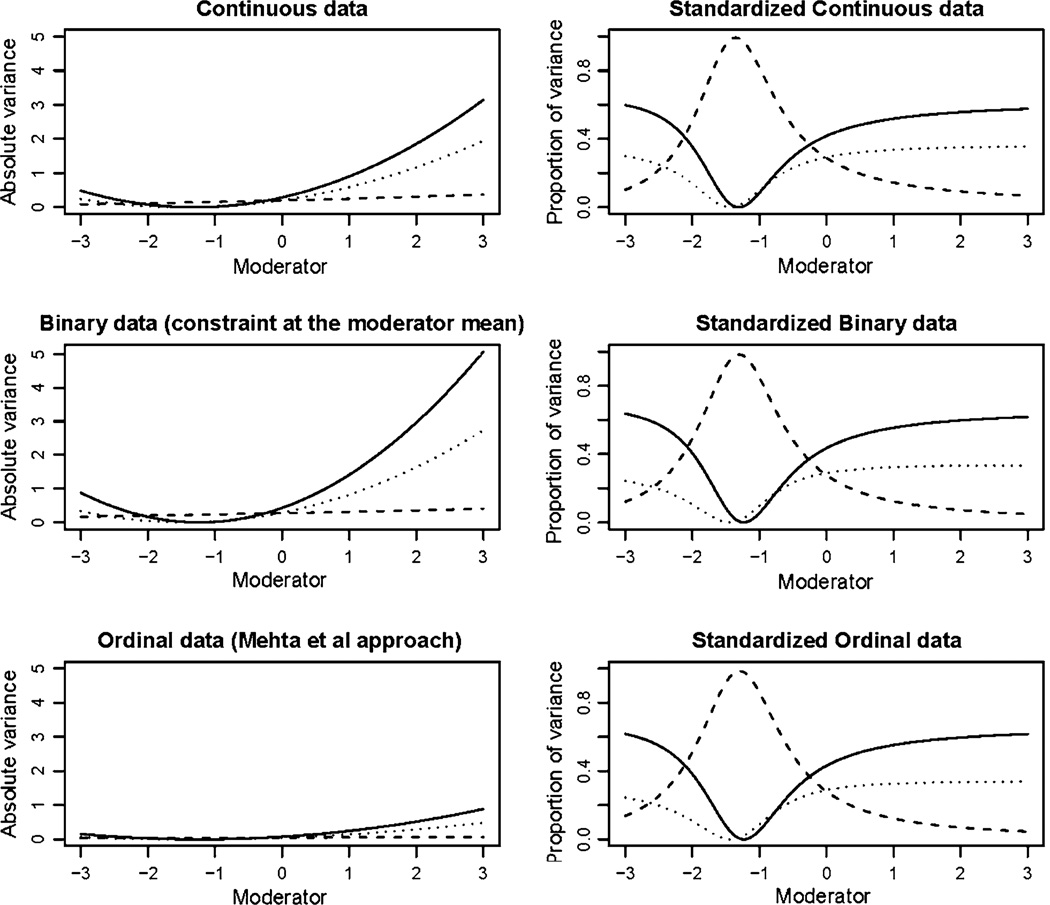
Fig. 3.
Results from simulation 1: additive genetic variance is indicated by the solid line, common environment as a broken line and unique environment by the dotted line. Absolute variance is shown in the left column with standardized proportions in the right column. The analysis of the continuous trait simulated prior to imposing the binary threshold is shown on the top row. The second row shows the results under a threshold model where the variance was constrained to equal one at the mean of the moderator (0). The third row shows the results obtained from the analysis of the ordinal data using the Mehta et al. approach

