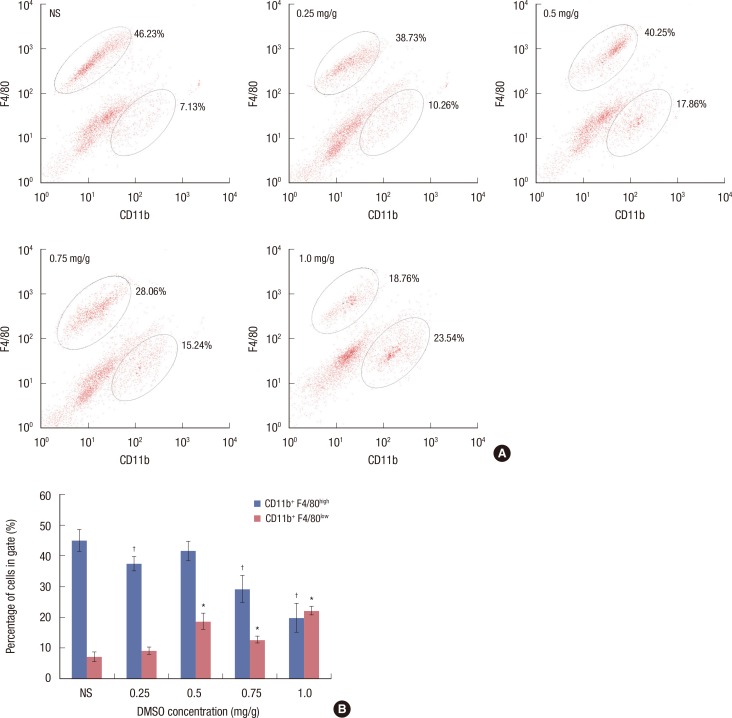
Figure 2.
Flow cytometry (FCM) analysis of macrophages in vivo. Tumors were minced and digested, 1×10⁵ dispersive cells in 100 µL PBS were stained with CD11b-FITC, F4/80-PE fluorescent antibody and tested by FCM. (A) The cells in upper circle represents percentage of CD11b+ F4/80high cells and cells in lower circle represents percentage of CD11b+ F4/80low cells. Graph shows CD11b+ F4/80low cell percentage increased while CD11b+ F4/80high cell decreased compared with control. (B) The statistic result of CD11b+ F4/80high cells and CD11b+ F4/80low cells. Bars represented means±SD. NS=normal saline; DMSO=dimethyl sulfoxide. *p<0.03 vs. control; †p<0.01 vs. control (n=5).

