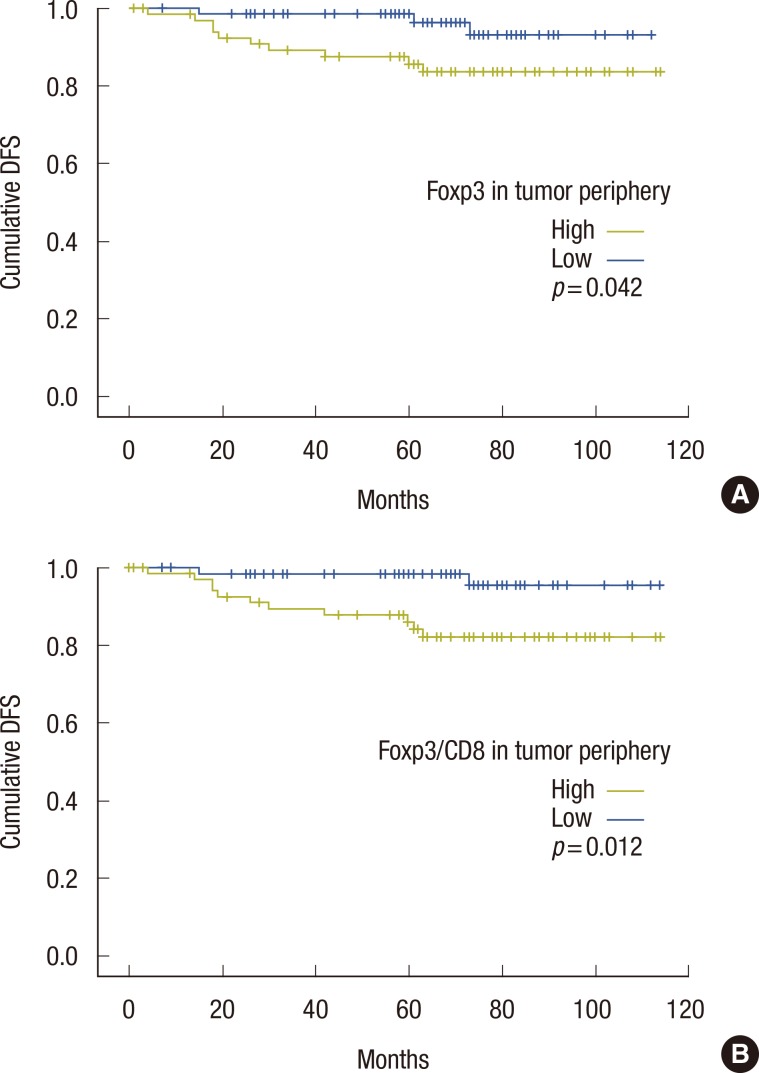
Figure 2.
(A) Kaplan-Meier survival curve comparing the high and the low forkhead box P3 (Foxp3) T reg infiltration group in tumor periphery. The 5-year disease-free survival (DFS) rate was higher in low Foxp3 Treg group than in the high Foxp3 Treg group (p=0.042). (B) Kaplan-Meier survival curve comparing the high Foxp3 Treg/CD8 group and the low Foxp3 Treg/CD8 group in tumor periphery. The 5-year DFS rate was higher in the low Foxp3 Treg/CD8 T cell group than in the high Foxp3 Treg/CD8 T cell group (p=0.012).

