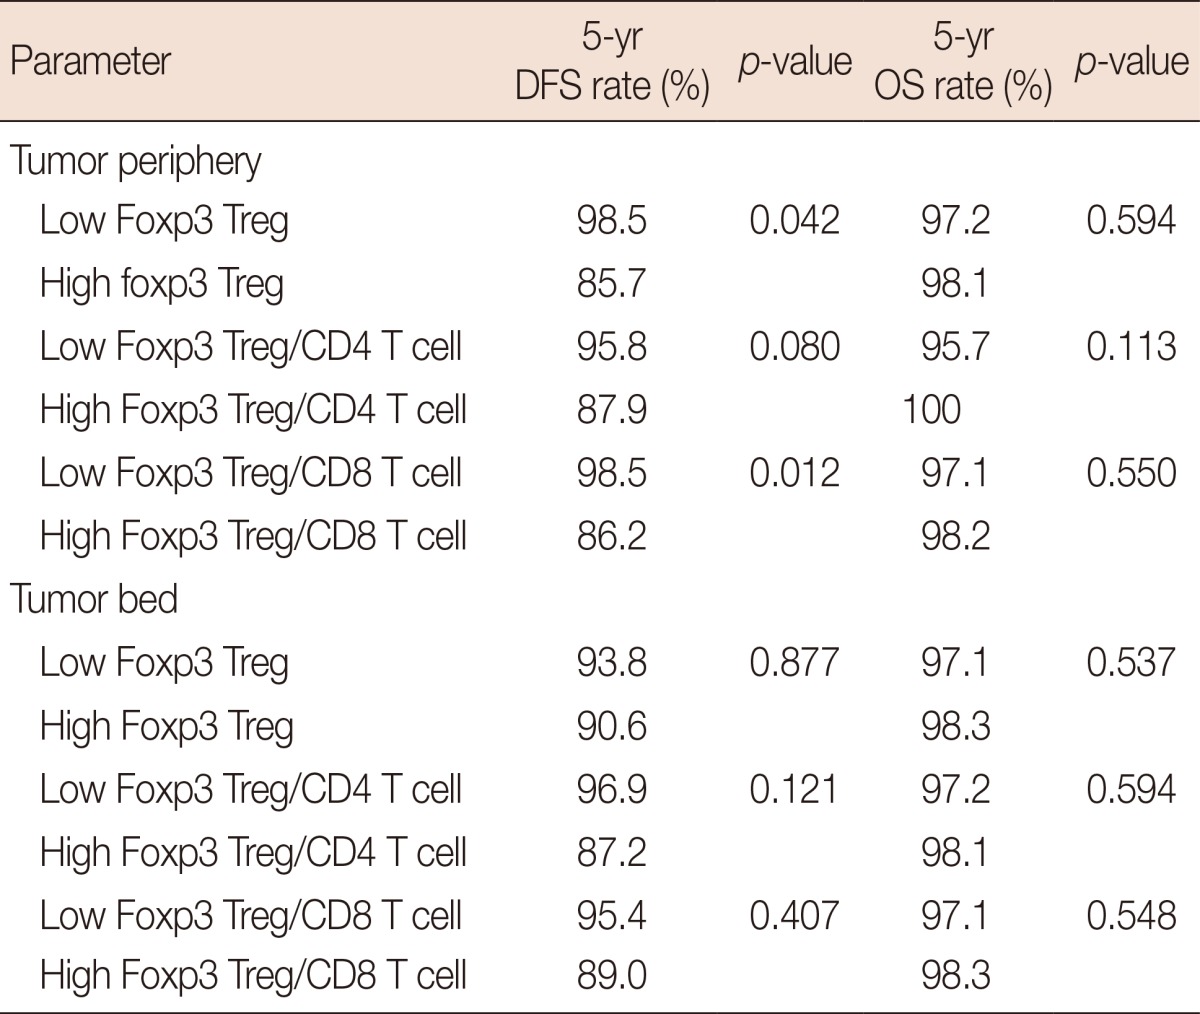
Table 6.
Univariate analysis of Foxp3, CD4, and CD8 T cell infiltration and disease-free survival and overall survival

Foxp3 Treg, Foxp3 Treg/CD4 T cells, and Foxp3 Treg/CD8 T cells were subclassified as high or low groups in reference to the respective median values. Foxp3=forkhead box P3; DFS=disease-free survival; OS=overall survival.
