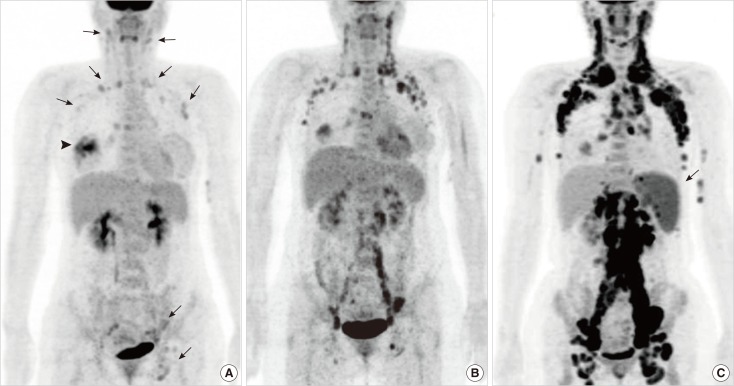
Figure 3.
Maximal intensity projection images of positron emission tomography/computed tomography (PET/CT) scans. (A) Maximal intensity projection image of the initial PET/CT scan shows multiple lymphadenopathies with mildly increased 2-[18F]-fluoro-2-deoxy-d-glucose (FDG) uptake in the axillae on both sides, in the neck, and in the left external iliac and inguinal areas (arrows). The arrowhead indicates high FDG uptake in the right breast mass. (B) PET/CT scan after the discontinuation of chemotherapy shows that the systemic lymphadenopathies are aggravated. (C) Follow-up PET/CT scan demonstrates aggravated lymphadenopathies throughout the torso. Note the newly appeared splenomegaly (arrow). Excisional biopsy of a neck lymph node reveals malignant follicular lymphoma.

