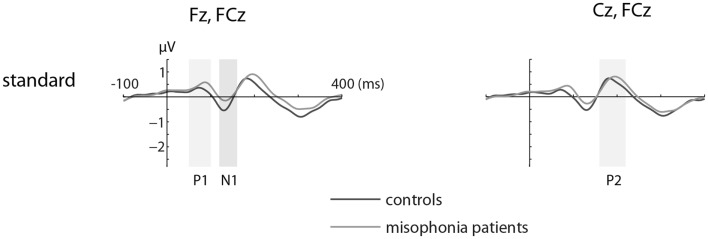
Figure 1.
The grand-average ERP waveforms of controls (n = 14) and misophonia patients (n = 20) for standard tones. Standard tones elicited equal responses for patients and controls when compared for average amplitude and peak latency of the P1, N1, and P2. Shaded areas represent time intervals of interest.

