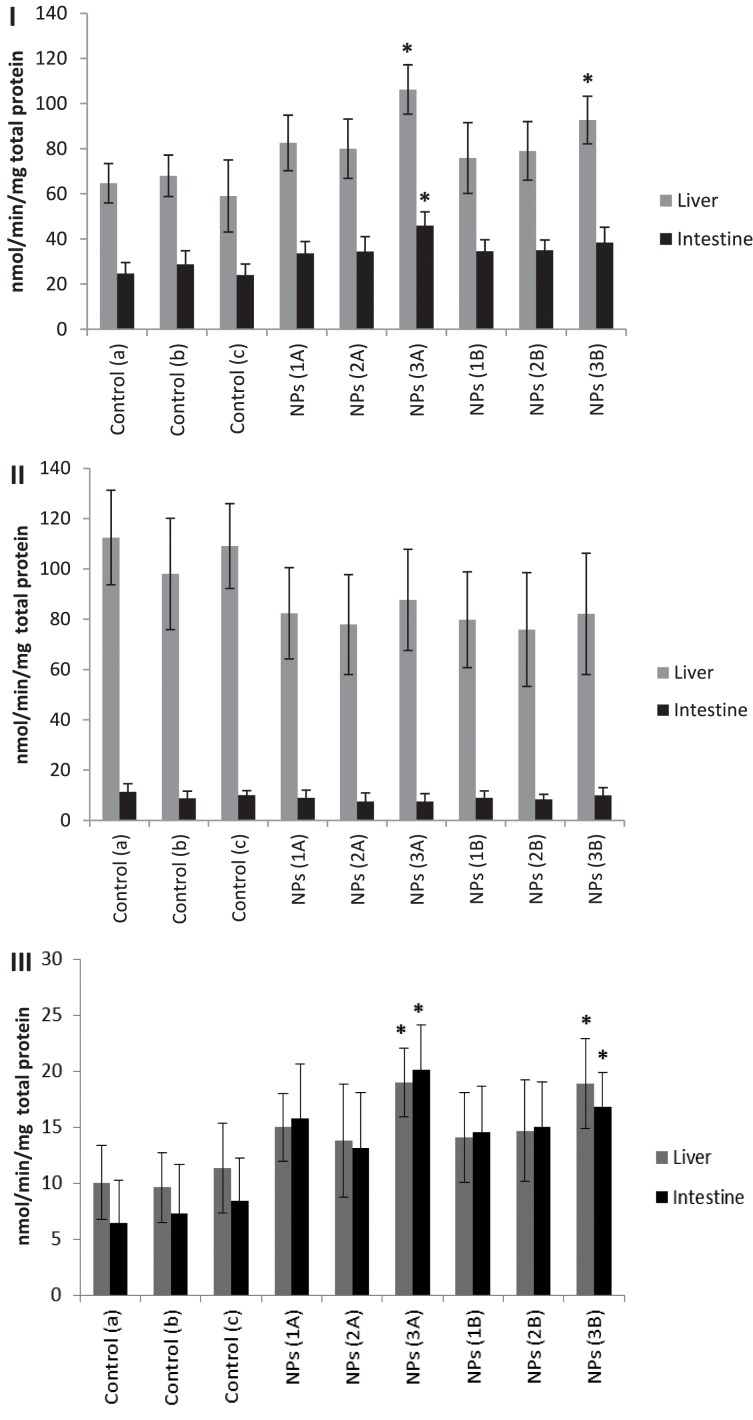
Figure 3.
(I) GST, (II) CAT, and (III) MDA concentrations in the liver and intestine tissues of Carassius auratus treated with AgNPs for 48 h. Data are presented as means ± SD. The asterisks indicate significant differences (p < 0.05) in comparison to controls. A—Intraperitoneal injection of AgNPs in PBS (1:10); B—Intraperitoneal injection of AgNPs diluted in corn oil (1:10). Legend: control (a) PBS (phosphate buffer solution), control (b) a solution of PBS and THF (1:10); and control (c) a solution of PBS and corn oil (1:10).

