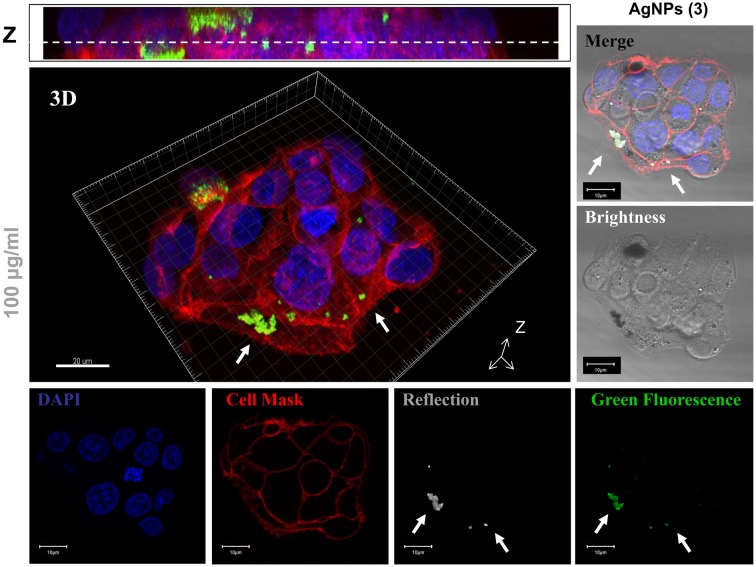
Figure 6.
Confocal Laser Scanning Microscopy (CLSM) in vivo images of internalized AgNPs (stabilized with compound 3) in HepG2 cells after 24 h of treatment at 100 μg/ml. Confocal images obtained of a single channels of nanoparticle fluorescence (green fluorescence), nanoparticle reflection brightness (gray), nuclear stain (DAPI), and membrane stain (Cell Mask) are shown. Merge images of all individual channels (merge), three dimensional reconstruction (3D) and Z projection (Z) allows to visualize the AgNPs particles into HepG2 treated cells. White arrows indicate the location of internalized AgNPs.

