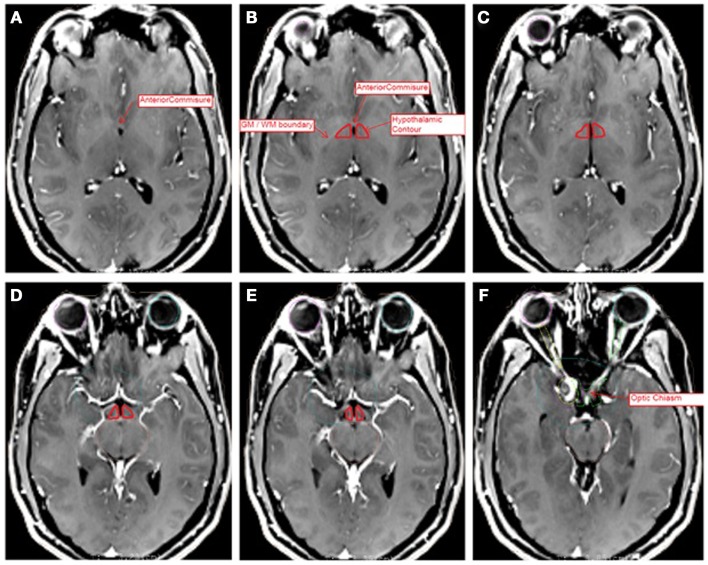
Figure 1.
Representative slices of MRI T1 + C images registered to CT data sets for hypothalamic volume contouring. Slices A (superior most) through F (inferior most) depict several anatomic landmarks for the delineation of the hypothalamic contour (red). (A) Depicts the superior most slice, at the level of the anterior commissure. (B–E) Depict the hypothalamic contour, bounded by the white matter tracts laterally, the third ventricle medially, the CSF space of the suprasellar cistern anteriorly, and the level of the interpeduncular fossa posteriorly. (F) Depicts the level of the optic chiasm, at which the contour ends. The contour has been enhanced for ease of visibility.

