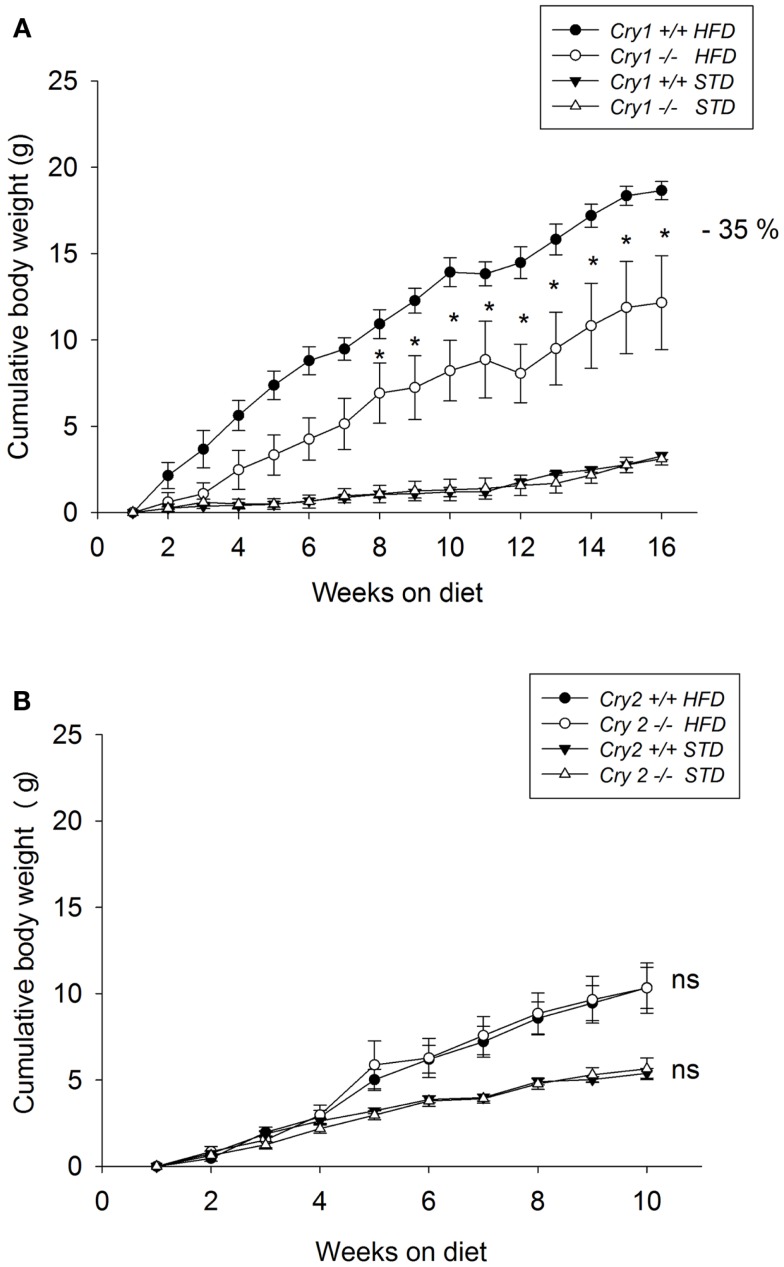
Figure 2.
Cumulative weight gain as calculated from mean weights of WT control, Cry1-, and Cry2-deficient mice under STD and HFD. (A) Cry1+/+ (filled symbols) and Cry1−/− (open symbols) mice, (B): Cry2+/+ (filled symbols) and Cry2−/− mice (open symbols), determined once a week, on STD (triangles) and HFD (circles) regimens. Cry1 group: n = 5 (Cry1+/+-STD) and 5 (Cry1−/−-STD) and n = 4 (Cry1+/+-HFD) and 5 (Cry1−/−-HFD); Cry2 group: n = 6 (Cry2+/+-STD) and n = 7 (Cry2−/−-STD), and n = 8 (Cry2+/+-HFD) and n = 6 (Cry2−/−-STD). *P < 0.05, ns P > 0.05 indicated for genotype comparison, two-way ANOVA for body weight with repeated measures on factor week. Values shown are mean ± SEM.

