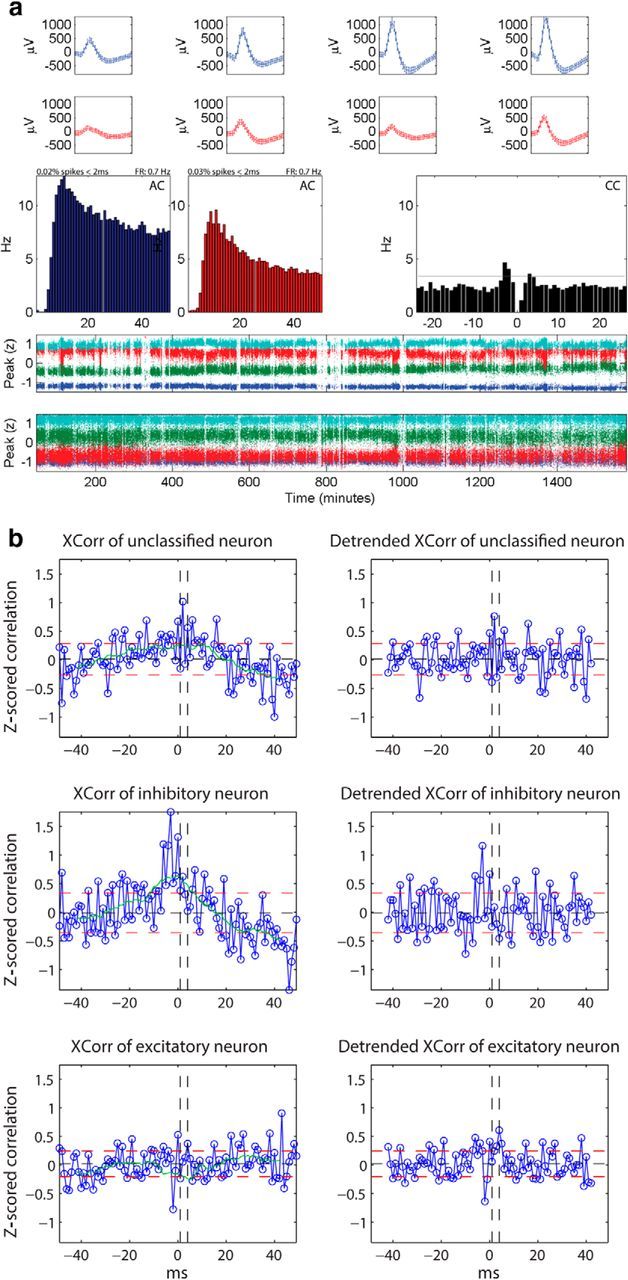
Figure 1.

a, Stability of neurons and cleanness of clusters recorded on the same tetrode. Average waveforms (top rows), autocorrelograms (AC, middle left rows), cross correlogram (CC, middle right rows), and time plots (two bottom rows) of two excitatory neurons recorded on the same tetrode are depicted. The percentage of spikes within 2 ms of refractory period included in the cluster and the firing rate are indicated above the autocorrelograms. Both clusters show distinct waveforms (each waveform is depicted for a 1 ms window) and have clean refractory periods (0.02 and 0.03%, respectively, spikes within 2 ms of refractory period). Their cross correlogram is reciprocally significant (EE2) at a significance threshold of α = 10−5 (gray horizontal line). b, Classification of neurons. In the left column, the average Z-scored cross-correlations of three different neurons, without the detrending procedure, are depicted in blue. Right, The corresponding detrended average Z-scored cross-correlations are plotted. The black horizontal dashed line depicts the mean, the red horizontal dashed lines depict one SD above and below the mean, respectively, and the green line is the moving average of the Z-scored cross-correlation computed with a moving window of 15 ms. The vertical black dashed lines represent the limits of the window of interest between 1 and 4 ms, within which short-latency peaks or troughs are assessed for classification. The top row represents an unclassified neuron that, without detrending, would have been classified possibly falsely as excitatory. The middle row shows an inhibitory neuron that without detrending, would have been classified as excitatory. The last row represents an excitatory neuron that would have been left unclassified without detrending.
