
Figure 2.
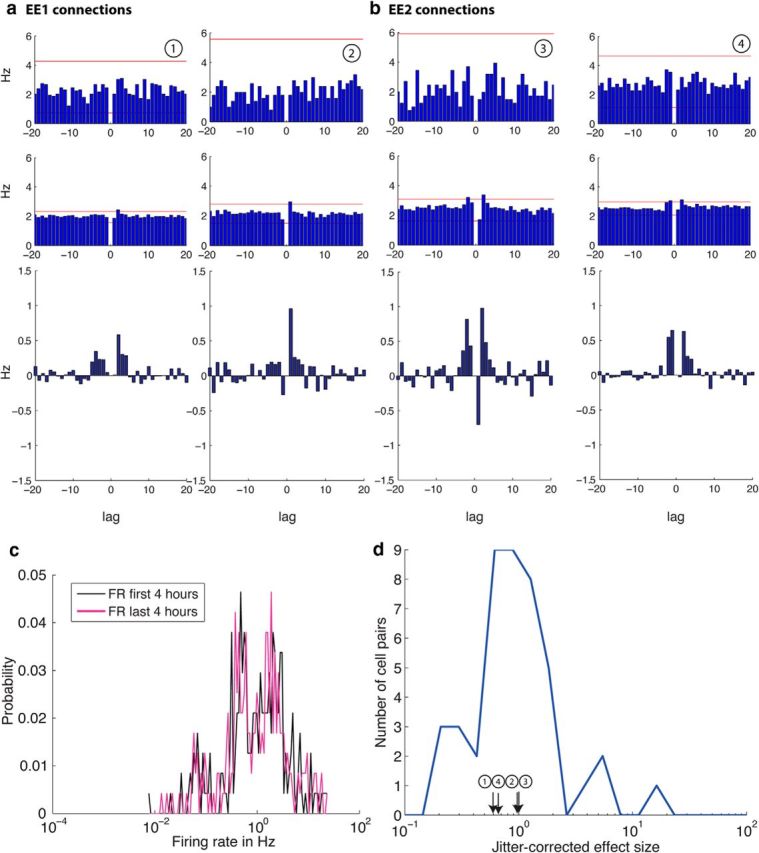
Examples of cross correlograms between two putative pyramidal neurons that are unidirectionally connected (a, EE1 connections) or reciprocally connected (b, EE2 connections).Top, Cross-correlations for 1 h spike trains and in the second row, cross-correlations for the same neurons pairs for 25 h spike trains are shown with a window size of 20 ms and a bin size of 1 ms. The red horizontal lines depict the significance level (α = abs) determined by 1000 spike-jittered cross-correlations. Note the improved signal-to-noise ratio in the 25 h cross correlograms (middle row), which enables the detection of small, short latency peaks. The bottom row shows the jitter corrected correlograms for 25 h obtained by subtracting the mean of the jittered cross correlograms of each cell pair from the original cross correlogram (middle row). c, The distribution of firing rate probability among all neurons for the first 4 h (black) and last 4 h (pink) of recording. The firing rate distribution for both recording intervals is lognormal. Note the log scale on the x-axis. d, The distribution of the jitter corrected effect size for EE1 and EE2 connections. The distribution of the jitter corrected peaks of the significant cross-correlations is lognormal as previously shown by Mizuseki and Buzsaki (2013). The peaks of the neuron pairs shown in a and b are indicated in the plot.