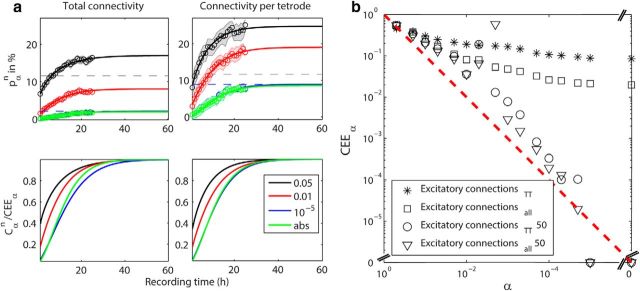
Figure 3.
a, Top, The experimentally derived detection probability pαn of excitatory connections. The median (circles) and 16th and 84th percentile (shaded area) of the detection probability are plotted for recording lengths of 1–25 h. The data in the left plot was normalized by the total number of possible excitatory neuron pairs (NAllEx) and the data in the right plot by the total number of possible excitatory neuron pairs per tetrode (NAllExTT). The results for four different significance α levels (color coded) are shown: 0.05, 0.01, 10−5, abs (note: the curves for the latter two levels largely overlap). The detection probabilities (Cαn, solid lines) were extrapolated until asymptote (CEEα) as estimated by the fitting of the statistical power function. The gray dashed horizontal line at 11.6% denotes the local connectivity as detected by Song et al. (2005) between pyramidal neurons in layer 5 of rat visual cortex. The blue dashed line indicates the asymptote as approached by α = 10−5. All R2 values indicating the goodness of fit are between 0.98 and 0.99. Bottom, The fitted detection probabilities (Cαn) divided by CEEα are plotted for NAllEx normalization (left) and for NAllExTT normalization (right). b, The asymptotes (CEEα) are plotted against the α levels on a log–log scale. Open squares and asterisks correspond to CEEα normalized by NAllEx and by NAllExTT, respectively. Both ways of CEEα estimation seem to approach a lower limit. Triangles and circles correspond to CEEα normalized by NAllEx and by NAllExTT, respectively, for the alternative window at ±50 ms. CEEα approaches zero as α becomes stricter. This is expected because no monosynaptic interactions are expected to be detected in the time interval of ±50 ms.

