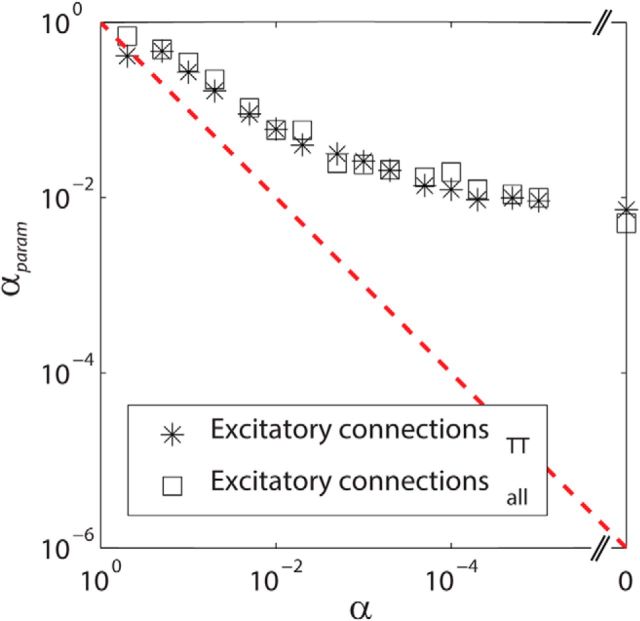
Figure 4.
The relationship between the significance level α and the fitting parameter αparam, obtained from Equation 8. Asterisks depict the results obtained with NAllEx and open squares depict the results obtained with NAllExTT. αparam deviates gradually when α gets smaller. This is likely due to the fact that μ1 is not a single value, but a distribution, which is not accounted for in Equation 8. However, α and αparam maintained a monotonically decreasing relationship. This suggests that separating αparam from α does not violate the original relationship of α = αparam substantially.

