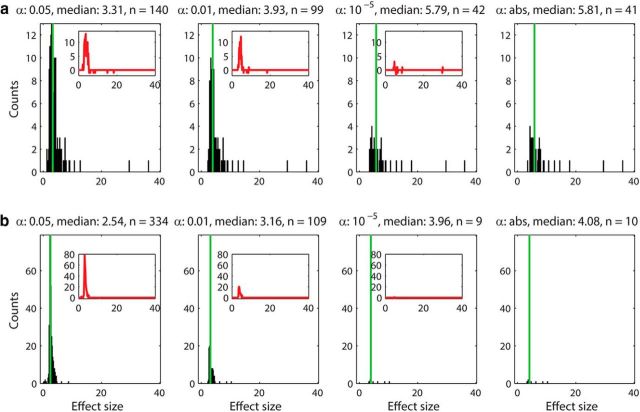
Figure 5.
The distribution of effect sizes (h) for short-range (a) and long-range (b) connections plotted for four different α values. The distribution of effect size for both unidirectional and reciprocal connections (EE1 and EE2) recorded within tetrodes (a) and between tetrodes (b) for four different α levels (0.05, 0.01, 10−5, and abs) are depicted. The number of peaks included, as well as the medians of the distributions are indicated above each histogram. The median is also plotted as a green vertical line. The results for α levels 10−5 and absolute limit are comparable. The distributions of effect size for α levels 0.05 and 0.01 are also similar. The insets show the difference between the most stringent group (α abs) and the less stringent groups (α levels 0.05 and 0.01). These counts correspond to weak effect sizes (<5) and most likely false-positives. The strong effect sizes (>10) are found in correlations between excitatory neurons recorded on the same tetrode, indicating that the strongest connections are mostly local.

