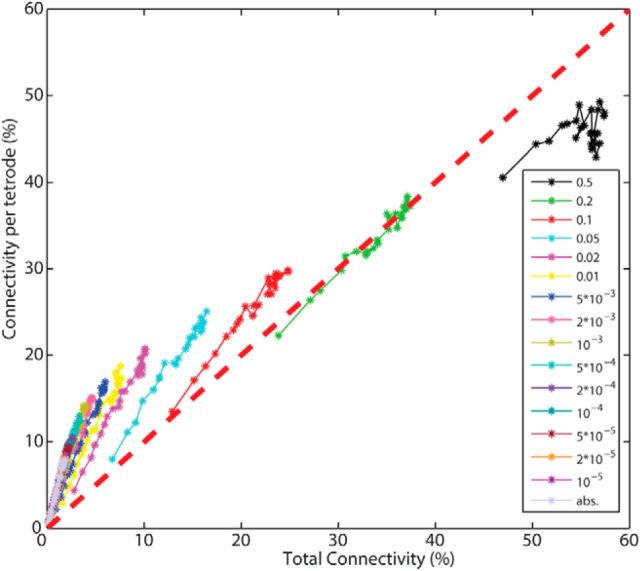
Figure 8.
The number of excitatory connections per tetrode (local connectivity, normalized with NAllExTT) is plotted against the total number of excitatory connections (total connectivity, normalized with NAllEx) for all investigated α levels. The red diagonal dashed line indicates equal probability between local and total connectivity (including within and between tetrode connections). The detected connections are predominantly local.

