
Figure 2.
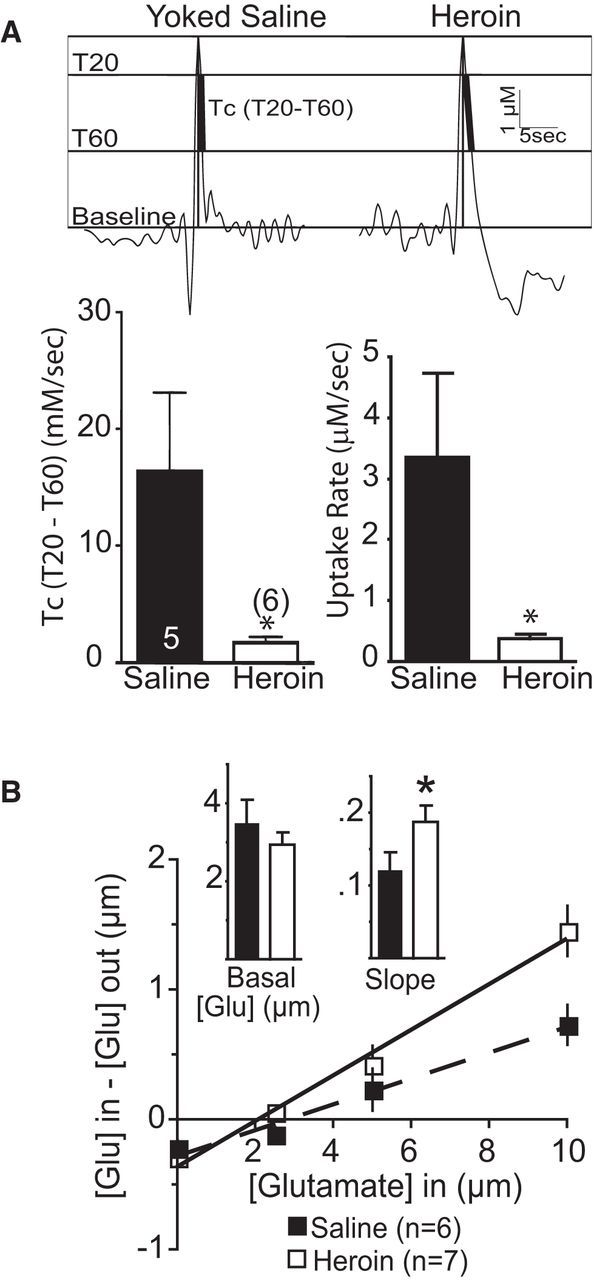
Slower rate of in vivo glutamate uptake in heroin rats. A, Top, Representative traces of K+-induced glutamate release showing where measurements were made at 20% and 60% of peak value. Bottom, Comparison between heroin and yoked-saline using two different estimates of glutamate uptake. B, No-net-flux microdialysis in the NAcore shows no difference in basal glutamate, but greater slope, indicating altered glutamate elimination. *p < 0.05 comparing heroin with yoked saline.