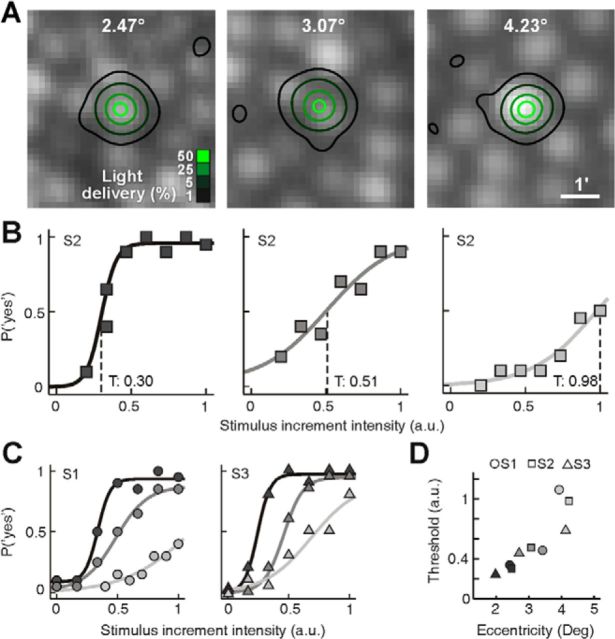
Figure 3.
Microstimulation threshold measurements. A, Light delivery distribution achieved in Subject 2 at three eccentricities, for 140-trial runs using the method-of-constant-stimuli approach. Note the increase in cone size and spacing with eccentricity. B, Psychometric functions were constructed by fitting a logarithmic function (lines) to the frequency-of-seeing data at each eccentricity (coded by gray level here and in C and D). Threshold, T, was defined as the intensity where the function inflects (dashed lines). C, Same as in B plotted for subjects S1 and S3. For the most eccentric test sites, modulation limits in the light delivery system (see Materials and Methods) result in a clipping of the upper portion of the psychometric function. D, Increment threshold was calculated from each psychometric fit and was plotted against eccentricity for all subjects, revealing a strong correlation between retinal eccentricity and threshold.

