Figure 1.
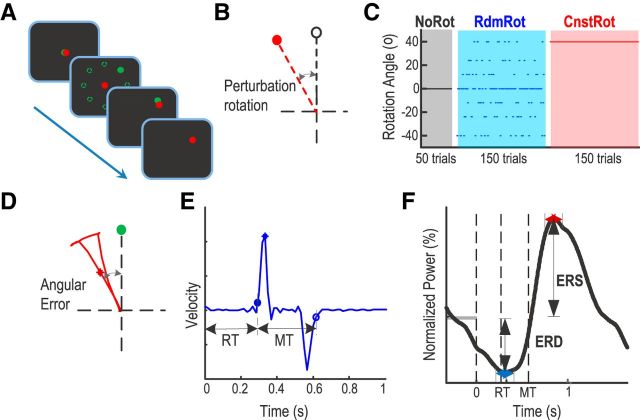
Experimental setup and measurements. A, Experimental paradigm. B, Perturbation was implemented as a rotation between the actual joystick position (in black) and its visual feedback (in red). C, Sessions with different types of perturbation: zero (NoRot), randomly changing across trials (RdmRot), or constant across trials (CnstRot). D, Calculation of initial angular error. Green circle represents the position of the target. Red line indicates the joystick cursor trajectory. Red star represents the position of the cursor at the point of maximal velocity. E, Calculation of reaction time (RT) and movement duration (MT) where time 0 is the timing of target position jump. Blue line indicates the velocity trajectory in one trial. Filled circle, star, and open circle represent the timing of movement initiation, maximal velocity, and termination, respectively. F, The calculation of event-related power change: the ERS and ERD. Vertical lines indicate the timing of the target jump, response initiation, and movement termination, respectively. Horizontal blue double arrow indicates the minimal normalized EEG power (trough) between cue and movement termination. Horizontal red double arrow indicates the peak normalized EEG power after movement termination. ERD and ERS are the average within a 200 ms window around the trough and peak, respectively.

