Figure 3.
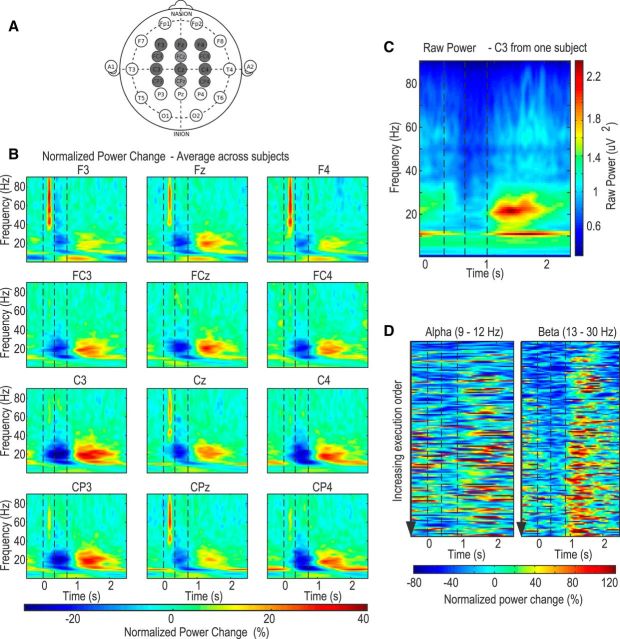
EEG data. A, Recorded EEG electrode placements in dark gray from the international 10–20 system. B, Group average normalized power spectra during trials with no rotational perturbation. Perimovement ERD and postmovement ERS were observed across different channels, but more prominently in C3 and CP3 contralateral to movement. C, Example power spectra from an individual subject showing clear separation between α and β reactivity in C3. D, Examples of trial-by-trial variation in C3 EEG from one typical subject in constant perturbation session showed α and β ERS increased with increasing trial execution order. However, this was confounded by reducing error across execution order. Vertical lines indicate the timing of cue (target jump), average response initiation, and movement termination.

