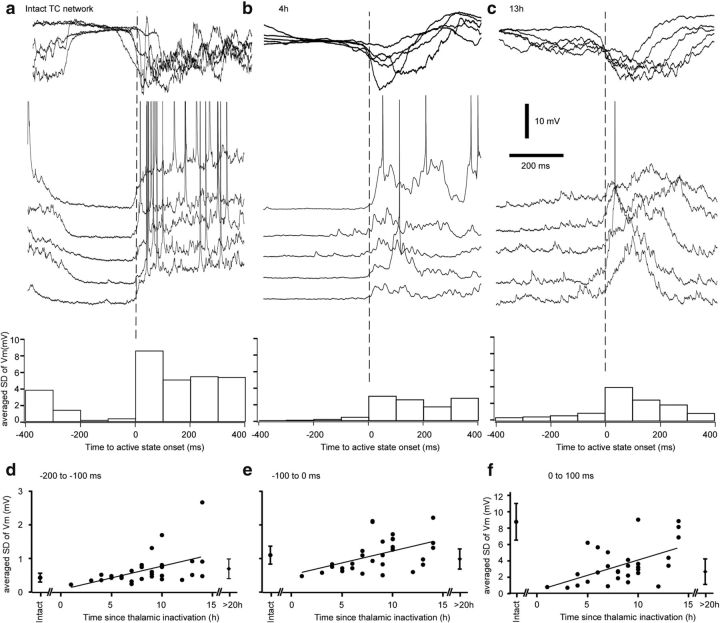
Figure 6.
Upregulation of synaptic activites after thalamic inactivation. Examples of LFP and intracellular recordings at the transition to the active state before inactivation (a), 4 h (b), and 13 h (c) after thalamic inactivation. Below traces are the corresponding averaged SD of membrane potential in bins of 100 ms. d–f, Averaged SDs are plotted against the time since the thalamic inactivation for the period −200 to −100 ms before active state onset (d), −100 ms to active state onset (e), and the first 100 ms of the active states (f).

