Figure 3.
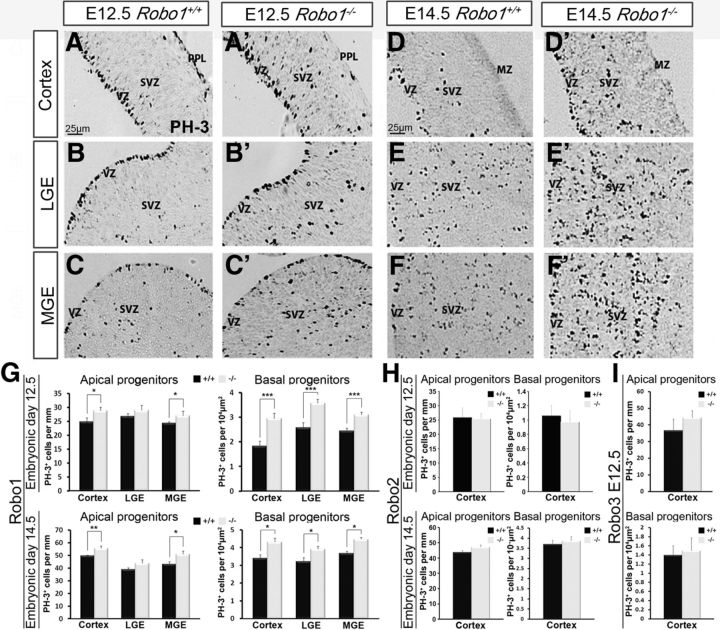
Increased PH-3-labeling in the telencephalon in Robo1−/−, but not Robo2−/− or Robo3−/− mice during corticogenesis. (A–F′) Images of coronal sections through the cortex (A, A′, D, D′), LGE (B, B′, E, E′) and MGE (C, C′, F, F′) at E12.5 (A–C′) and E14.5 (D–F′) showing mitotically active cells labeled with PH-3 in the VZ and SVZ of Robo1+/+ (A–F) and Robo1−/− (A′–F′) mice. G, Histograms indicate the presence of a significantly greater number of mitotically active apical and basal progenitors at E12.5 and E14.5 in Robo1−/− mice. H, Similar analysis in Robo2−/− mice at E12.5, E14.5, and in Robo3−/− mice at E12.5 (I) did not show any significant differences in PH-3-labeling of apical or basal progenitor cells in the dorsal cortex. Histograms show means and error bars represent SEM; *p < 0.05, **p < 0.007, ***p < 0.0009. MZ, Marginal zone.

