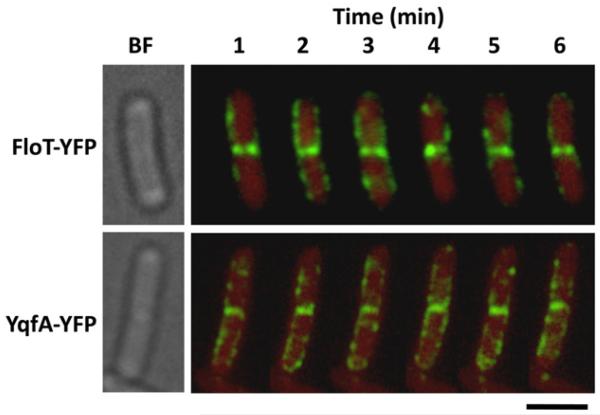
Fig. 3. Flotillins appear static at the midcell.
Time-lapse fluorescence analysis of the distribution pattern of FloT–YFP and YqfA–GFP foci. Cells were grown in liquid shaking MSgg at 30°C for 8 h. Exponentially growing cells were mounted on agarose-coated slides. The upper row shows the distribution of the FloT–YFP foci (DL1295, false-coloured green) within the same cell for 6 min. The bottom row shows the distribution of the YqfA–GFP foci (DL1367, false-coloured green) within the same cell for 6 min. Background is represented in red for better contrast of the fluorescent signal. Scale bar is 2 μm.

