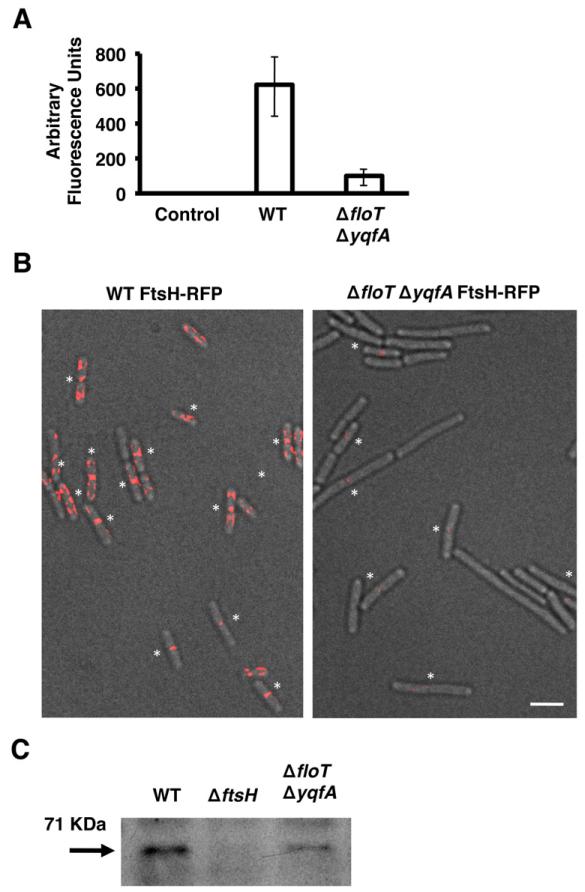
Fig. 4. The ΔfloT ΔyqfA mutant displays lower levels of FtsH.
A. Relative fluorescence of wild-type (WT) strain and ΔfloT ΔyqfA mutant labelled with the translational fusion FtsH–RFP (AY224 and DL1565 respectively). Cells were grown in liquid shaking MSgg at 30°C and harvested at mid-exponential phase (approximately 8 h of incubation; OD600 = 0.8). Quantification of relative fluorescence signal was assigned as fluorescence arbitrary units and presented in a graph. Error bars indicate standard error of the means.
B. Fluorescence micrographs overlayed on transmitted light images of WT and ΔfloT ΔyqfA mutant, both harbouring the translational fusion FtsH–RFP (false coloured in red). Asterisks indicate the fluorescence signal positioned in the septum of dividing cells for better visualization. Scale bar is 2 μm.
C. Immunoblot of FtsH protein in the indicated B. subtilis strains using polyclonal antibodies against FtsH. The arrow indicates the presence of a band with the size predicted for FtsH. Each lane contained 25 μg of total protein.

