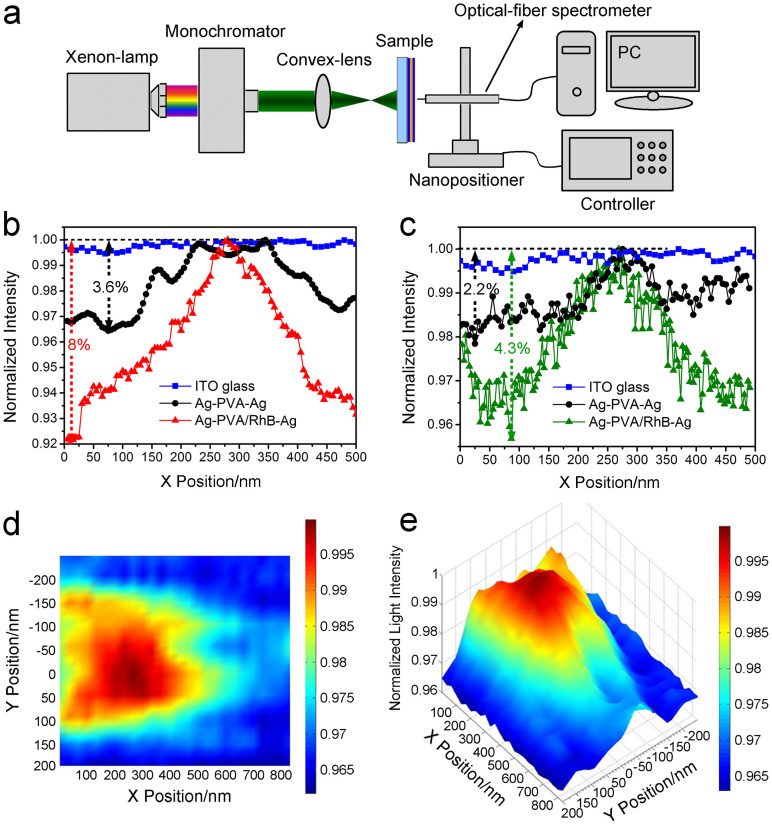
Figure 6. Experiments for transmission enhancement.
(a) The experimental setup. (b) The blue, black and red curves respectively correspond to the ITO glass, the red-light resonant samples without and with RhB. (c) The blue, black and green curves correspond to the ITO glass, the green-light resonant samples without and with RhB, respectively. The horizontal axis represents the positions of the beam of monochromic light when it passes through the flat sample and leaves its right-hand-side surface (zero point is set at this surface). The vertical axis represents the measured normalized intensity of the output light beam. (d) and (e) respectively show the two- and three-dimensional images of the transmission enhancement for the green-light resonant samples with RhB.

