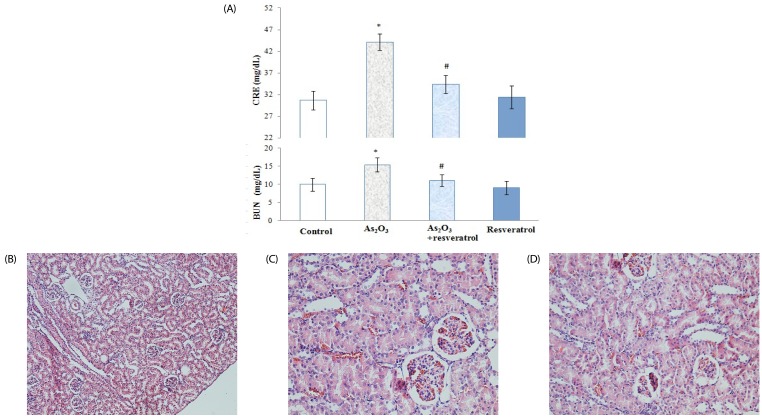
Fig. 2.
Functional markers and morphological evaluation of rat kidneys. (A) BUN and CRE content in serum; (B) control rats; (C) As2O3-treated rats; (D) As2O3-treated rats with resveratrol. All values are expressed as the mean ± SEM (n = 8). *P < 0.05 when compared with the control group; #P < 0.05 when compared with the As2O3-treated group. Original magnification, 10×20

